Showing posts with label unusual. Show all posts

Monday, March 21, 2016

UPDATED....Is a significant snow event possible for Spokane,Coeur d'Alene or the Palouse late tonight and tomorrow morning?

So as we talked about yesterday, an unusually tricky weather scenario looks like it will unfold over the Inland Northwest. So what are we fairly certain about? We are fairly confident that a slow moving upper-level low-pressure system will take up residence over the Inland Northwest and produce a band of moderate to locally heavy precipitation. The big questions to answer are where is this band going to set up and will it cool the atmosphere enough that we could see some significant snow. The setup producing the unusual event looks quite similar to what we discussed in our previous blog. We still expect to see strong lifting associated with a slow moving upper level low parked somewhere over eastern Washington. Notice the green shaded area (representing upper-level moisture) remains parked over eastern Washington and the central Idaho Panhandle through much of Tuesday.


500 mb pattern 2am Tue-5pm Tue
The lifting from the low will be accompanied by plenty of moisture and instability which should be perfect for producing a band of precipitation. Just how much precipitation are we talking about? A lot to say the least. The areas in purple represent totals between 0.50-1.00 inches of liquid and the reds and yellows equate to amounts between 1.00-1.50 inches. This is for the 12 hours between 2am through 2 pm Tuesday. Notice the band of heavy precipitation has eeked farther north than what we were looking at in yesterday's forecast and blog.

Latest 12 hr precipitation forecast 2am Tue-2 pm Tue

Previous 12 hr precipitation forecast for 2am Tue-2pm Tue

We still highly suspect that whatever verifies from a precipitation standpoint will more closely resemble the top two panes showing a heavy east-west oriented band vs the more poorly defined precipitation blob in the lower two panes.

Since the forecast is nearing in time we can also use one of our favorite tools called the HRRR (a rapidly updating model that runs hourly and can ingest current weather conditions). Let's see what the latest run of it says. The loop below is a simulation of what the radar is expected to look like. Green and yellow shading indicates where the heaviest precipitation is expected.

Radar simulation for Tuesday morning

So this also boosts our confidence that this event is going to occur. Each subsequent run of this model continues to show a similar radar formation (with small variations in location).

Now the largest problem remains is will the temperatures cool down enough to support snow. The models vary in this regard and there is a fine line as to whether or not snow can fall and then whether it will get heavy enough so it can accumulate on roads. The odds of rain changing to snow over the Inland Northwest look fairly good especially over Idaho and southern Spokane County and northern Whitman County. However a tougher question to answer is will the snow be able to accumulate on the area roads? If the snow gets heavy enough the answer is yes, however if not, most of the accumulations will occur on grassy surfaces. So once again lets look at the plume diagrams to see how much snow 27 different model runs produce over Spokane, Coeur d'Alene and Pullman.

Spokane plume diagram shows snow totals ranging from 0.0 - 2.5" with an average around 0.3" 


Coeur d'Alene plume diagram shows snow totals ranging from 0.0 - 5.3" with an average around 0.8" 

Pullman plume diagram shows snow totals ranging from 0.0 - 3.5" with an average around 0.5" 

Generally speaking, these values are on par with what the models were showing last night, however with the band moving further to the north, the snow totals in Pullman are trending lower. Motorists are still urged to check the latest forecast before venturing out in the morning and be prepared for a potentially snowy commute. Here is our latest snow forecast.

Snow forecast for Tuesday (issued 9 pm Monday )


1145pm Monday Update....the band of precipitation was beginning to take form. Our confidence is growing the moderate to locally heavy precipitation band will develop. Still not sure if heavy snow will accumulate.

1147pm radar imagery. Note heavier precipitation developing between  Davenport and Ritzville. 


Is a significant snow event possible for Spokane,Coeur d'Alene or the Palouse Tuesday morning?


Although the weather of late has been quite wet, the overwhelming majority of the precipitation has fallen as rain (or melting snow) in the valleys of eastern Washington and north Idaho including the Spokane/Coeur d'Alene area and the Palouse. That might change however as an unusual weather pattern materialises on Tuesday morning resulting in the possibility of significant snow. So what is the weather pattern which might lead to this unusual snow? To get significant snow in the valleys this time of year you need several things. First, you want to have a fairly strong upper-level trigger. In this case, we will be dealing with a slow moving upper-level disturbance or vorticity maximum.

500 mb pattern 2 am-2 pm Tuesday

The emphasis is on slow. The loop above shows the disturbance quite nicely between 2am-2pm Tuesday. The green area represents where the forecast model is placing the best moisture. Notice the feature also looks like a semi-circle indicating a tight circulation in the upper atmosphere which should lead to increased upward motion.

Another ingredient we like to see to enhance this upward motion is deep instability. This helps enhance the upward vertical motion between the ground and the upper atmosphere. So will the atmosphere be unstable? You bet. The orange and red shading indicates where we expect to see the most instability (however it's unstable everywhere across the region.
Lapse Rates through the mid-atmosphere 2am Tue
So couple the presence of the instability and the upper-level disturbance and here is where one model solution suggests we will see the greatest lift. Areas in purple and light purple are where the models expect to see the greatest ascent and thus the best potential for precipitation.
Upward motion through the mid-atmosphere 2am Tuesday

Finally, you need an atmosphere which is cold enough to support snow. This is the least confident part of the forecast. Model solutions are suggesting that the temperatures before the precipitation arrives early Tuesday will be above freezing, but then they slowly fall as the precipitation intensifies during the morning at least over a very small area (denoted in light or dark blue).

8am Tuesday Temperatures

So we have the ingredients in place for a heavy precipitation event (albeit fairly localized). Now the question is where will this band of precipitation set up and will it become heavy enough that it can produce accumulating snows in the valleys. That is a tough question to answer since there has been considerable model variability. What we can gather is more often than not the model solutions have depicted a northwest-southeast or west-east oriented band of precipitation similar to the two panes in top portion of the image below. Some of these amounts are quite impressive. The areas in purple show precipitation amounts above 0.75 inches and the red areas are showing more than an inch. So is it possible that most of not all this will fall as snow? It is certainly a possibility. 

12hr precipitation amounts forecast between 2am-2pm Tuesday
So just how much snow are we talking about?  Well here is a plume diagram showing 27 different model possibilities or solutions for the Pullman/Moscow area. While some of the models are hinting at a little more than a trace of snow, the most impressive solution is showing nearly 8 inches! The average snow amount from all the variations is just over 1" of snow.  For the Spokane area, the forecast is nowhere close to as snowy as for Pullman. The maximum snow forecast is around 2.25" but the average is around a quarter inch. That's a lot of variation, to say the least. 

Plume Diagram for snow for Pullman (Click image for larger view)


Plume diagram for snow for Spokane (Click image for larger view)

So what do we expect to happen? We are fairly confident we will see a band of moderate to locally heavy precipitation develop on Tuesday morning. Again the question is where will this occur and will the atmosphere be cold enough to support heavy snow? The other variable is will the ground be cold enough allow accumulations to occur on the roads? If the snow gets heavy enough (quite possible) we suspect the answer will be yes. Motorists are urged to prepare for the possibility of winter driving conditions for the Tuesday morning commute. Chances are the afternoon commute will be much easier as any threat of accumulating snow diminishes. Hopefully, as the event nears our confidence will grow as to where we expect to see the greatest risk of significant snows. 


Sunday, May 31, 2015

Does Monday still look like a severe day?

A few days have come and gone since our last post about the potential severe weather event for the first day of June. So how are things looking now that the event is nearing? Well according to the water vapor imagery below, it's looking pretty good. See the swirl off the northern California Coast? That's the deep low-pressure system which will deliver the active weather as it moves toward the Inland Northwest. Why is this low important? Well for a good thunderstorm day we need three key ingredients: lift, instability, and moisture. The low will provide us with the first ingredient.

Animated water vapor imagery. Note the swirl off the Northern California coast. 

The models are very consistent in taking this low from its current position off the California Coast toward the Washington/Oregon border by afternoon and then toward the Washington/BC border by evening. This pattern resembles the typical negative tilted pattern we associate with severe weather in the Inland Northwest. The track of the low will ensure that the region will be subject to strong lifting potential beginning in southern Washington and central Idaho in the morning and spreading northward through the day. 

500 mb forecast with precipitable water forecast


Notice the shading in the 500 mb map above? That represents the precipitable water forecast. The greens, blues, and purples depict where the juiciest air will be located, Initially the pool of moisture, currently over far northern Oregon, will shift northward tonight and then become enhanced with even more moisture from the incoming low. How much moisture will we see? We forecast that using  a parameter termed precipitable water. Precipitable water is a figure used to represent how much water the atmosphere is holding. The precipitable water forecasts are expected to reach  values are forecast to exceed an inch over portions of the Inland Northwest by afternoon. How unusual is that? According to the graphic below, it would be placed in the 97.5-99th percentile for this time of year. So it will be far from typical. 

Precipitable Water anomaly
So with the two key pieces in place, what about the third, instability? Well it looks like that piece of the puzzle will be realized as well. If you recall our previous blog post, one of the ways to measure potential instability is looking at the lifted index values. If we see negative lifted index values, that indicates potential instability. So as early as 5 am, we begin to see some of this instability. Notice the yellow and orange shading over southeast Washington? This is enough instability to support thunderstorms even without the benefit of daytime heating. 
5am Monday Lifted Index Forecast
How about later in the day? Suffice it to say the instability will not be lacking. The entire region is expected to see negative lifted index values, with the best instability represented by the -6 to -8 values over extreme eastern Washington and north Idaho. That's about as good of a lifted index as you can expect to see over the region. 
5 pm Monday Lifted Index Forecast
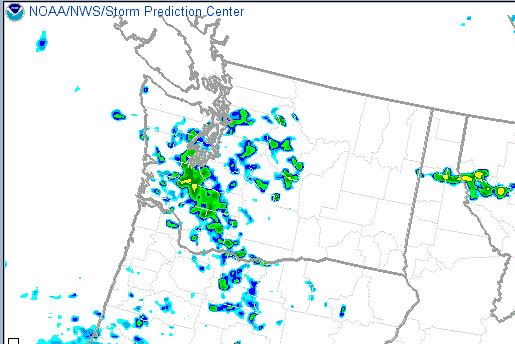
So with all the pieces in place what would we expect to happen? We think there will be a band of showers and thunderstorms early in the morning spreading across the Washington/Oregon border, which should slowly work their way northward through the morning. How extensive this band will be remains rather uncertain. One of the weather models is forecasting the radar to look like the image below. Notice the nice cluster of showers and thunderstorms near the Blue Mountains in SE Washington. This coincides nicely with the good pocket of instability forecast by another model.  

7 am simulated radar image

By midday, this band is expected to drift farther north, but could lose some of its definition and strength.  
11 am simulated radar
However, the first band which moves through will further moisten and destabilize the atmosphere before the strong upper-level disturbance tracks toward our region. So what will the afternoon look like? This is far from certain, and there are as many answers as there are high-resolution models. Here's just one of the forecasts for 5 pm. 

5 pm simulated radar
That is a pretty impressive simulation with strong thunderstorms located across the northern portions of Washington as well as in the southern Idaho Panhandle. However recall that the best instability (or lifted index values) were located over the Idaho Panhandle. So we have better faith in the eastern portions of this radar simulation verifying. Another thing we can look at is an ensemble of simulated radar returns. The image below shows where the greatest risk will be for the biggest thunderstorms (chances of having a 40 dbz or stronger radar echo). The regions shaded in purple have the best chances (over 90%) followed closely by the reds (over 70%). This would highlight two areas. The Cascade crest and over the southeast corner of Washington and the southern Idaho Panhandle.
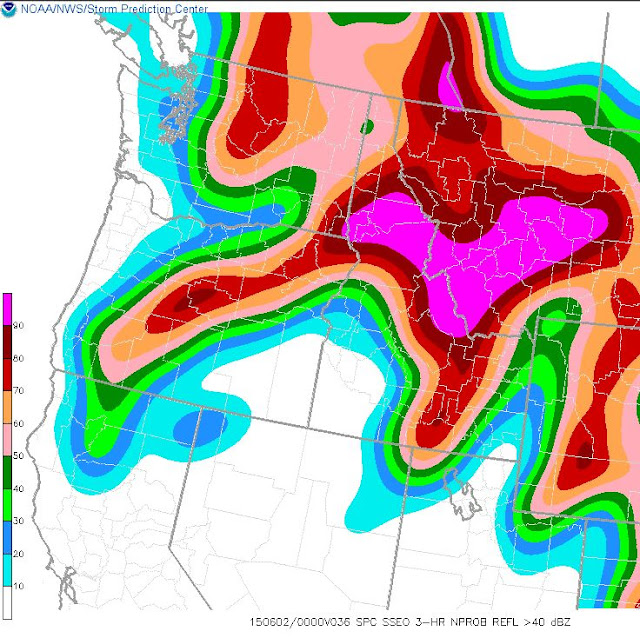
Ensemble chances for 40dbz or higher echoes
So what will the main risk of severe weather involve tomorrow? Based on the instability, the biggest risk looks to be large hail. If we look at the model soundings they are likely a little too moist to support widespread wind damage, however, we still expect to see some strong wind potential with a few of the storms. 

So what is the typical weather we experience with this type of upper-level pattern? We can utilize a fascinating tool produced by the Cooperative Institute for Precipitation Systems (CIPS) at Saint Louis University. They created a tool that makes an analog of the 15 closest weather patterns (since 1980) to what the forecast weather pattern is supposed to be. So below we see the forecast for tomorrow in red compared to the mean of the top 15 analogs (or pattern matches). This looks like a pretty good fit.

500 mb forecast for tomorrow (red) plotted against the 15 top weather analogs since 1980
So what weather was experienced on those days? Interestingly enough, quite a bit. Of those 15 days that matched Mondays expected weather, there were widespread severe reports. Most of them were related to hail, but a good sample of the reports were related to wind as well. Also, notice there were 3 tornado reports in the Inland Northwest. We do not expect to see tornadoes on Monday, as the wind patterns are not quite right to support violently rotating storms, however, they have occurred in this weather pattern before. 
Severe reports from the top 15 analog days to Monday's weather pattern

The other risk we see tomorrow will be for flash flooding. The storms which develop tomorrow will obviously contain copious amounts of moisture. And more importantly they could be slow movers. 
The risk of heavy rains will likely continue through Monday night before tapering off. Here's a look at the 24-hour precipitation forecast from 4 different weather models.

Precipitation forecast from 11am Mon-11am Tue
That's a lot of precipitation (purple amounts are above  0.75") and there is a fairly consistent message that the bulk of it will occur across the northern quarter of Washington, the Cascade Crest, and over the Idaho Panhandle. Since much of this will be attributed to thunderstorms, there is likely to be a high variability over short distances, with some areas likely to receive much heavier amounts. 

Stay tuned for updates to the forecast as this will likely be a very active weather pattern. 

Monday, May 18, 2015

How is this Memorial Day Weekend looking weather-wise?

Last year at this time, we composed an extensive blog discussing the connotations associated with Memorial Day weekends in the Inland Northwest.  In many parts of the country, this weekend typically kicks off the summer season. However here in the Inland Northwest that really isn't the case, due to continued cool and unsettled weather. So is this year going to fit the weather mold, or will we see warm and dry weather?

Before we delve into this year's weather scenario, lets look at what the typical weather pattern is for this time of year. Looking at the mean 500 mb (18k ft MSL) maps below we see that the typical weather pattern is to see moist southwest flow pointed into the Pacific Northwest with a ridge setting up just downstream of the Continental Divide in western and central Montana. 


500 mb mean map 5/23-5/31
So what about the temperatures associated with this average pattern? Here's  the average temperatures for a couple locations as well as the average chance of precipitation:

So not bad. An average high around 70°F with rain expected on roughly 1 out of 4 days doesn't sound too terrible. But that's climatology and this weekend's weather could vary significantly from the norm. Why you ask? Well, let us take a look at the 500 mb pattern for this weekend to get an idea what sort of weather we might be dealing with. First off, here's a look at the weather for Saturday. 


GFS 500 mb heights for Saturday
This does not look promising if you enjoy plenty of sunshine and warmth. Note the closed low-pressure system (yellow L) centered over northwest Washington. Low-pressure systems like this are typically associated with cool and unsettled weather, especially if your are under or near the low. But this is only one model run. Surely there are other ideas out there in weather land. Well, here's a look at 4 distinct weather models for the same time period.
500 mb pattern from 4 different weather models for Saturday
Notice all these model runs place a low somewhere over the Pacific Northwest. That raises our confidence that the weather will be cool and unsettled over portions of the region, but maybe this unsettled weather will only last for a day. So let us take a look at the Sunday weather pattern.

500 mb pattern from 4 different weather models for Sunday
If the upper left model solution verifies (the GFS), the Inland Northwest could really be stricken with another cool and wet day. The other model solutions would hint at some modest improvements, but far from what we would deem summer like weather. How about Monday then?

500 mb pattern for Monday
The upper left solution (the GFS) still keeps the low parked over Washington while the others either drop it south of the region or weaken it. We shall see. But what if the GFS solution were to verify? What would our weather be like? If you love rain, well then you will love this forecast. Here's a look at the total precipitation forecast for Saturday and Sunday.
Rainfall forecast for Saturday and Sunday
The swath of red shading indicates rainfall amounts in excess of an inch. This includes Spokane, Kellogg, Coeur d'Alene, Pullman, Lewiston, Banks Lake, Lake Roosevelt, and Colville. If you look even closer there are a few locations which are expected to see in excess of 2 inches (shaded in tan)!
Now that is a lot of rain, regardless of the time of year. If the precipitation were to materialize, it would equate to our wettest Memorial Day weekend since 1997 and the second wettest on record (since 1970). So what is our confidence level in this precipitation panning out at this point?

Another tool we can look at in addition to just a few deterministic model runs is from an ensemble forecast approach. This is where you look at multiple model runs (initialized from the same model) and try to gather where the forecast confidence in the precipitation swath is greatest. Using this approach, the news isn't great either.

NAEFS/GEFS Ensemble precipitation amounts for the 48 hrs ending Sunday Afternoon
Without delving too deep into the specifics of the image above, the black lines depict the average precipitation amounts from the ensemble mean precipitation forecast while the green and blue shading (well any shading really) is bad if you like dry weather.  Notice the black lines hint at a swath of precipitation extending from southern British Columbia to the central Idaho Panhandle. The green and blue shading suggests the 48-hour precipitation amounts are in the 99-99.9% percentile for an early April-early July event. In other words, it is a 1 out of 100 or 1 out of a 1000 event for this particular time of year! There is even a small area of pale blue which hints that rain of this magnitude for this time of year has not been experienced since between 1985-2011!  This map suggests the GFS isn't entirely alone in forecasting a wet weekend, but we would like to see much better model agreement before buying off on this solution.

Now, if the rain does materialize, what impact will  this have on our temperatures?
7-day Spokane Forecast
Our current forecast is showing highs above average through the workweek with a cooldown by the weekend. Notice by the weekend we are forecasting highs right around 70 each day. That's not bad. Right around average actually. But we discounted the wet GFS solution. What if the GFS were to verify? How warm would it get then?


7-day temperature meteogram for Spokane
See the green line on the chart above? That is our official NWS forecast. However the blue lines (from the GFS) show the highs on Saturday could struggle to escape the mid-50s on Saturday and then slowly rebound into the lower to middle 60s for Sunday and near 70 on Monday.

Stay tuned to later forecasts this week to see how wet this weekend might really get. In the meantime, you might want to procure yourself one of these if you have camping plans this weekend.


Thursday, February 5, 2015

How unusual will this next episode of warm and wet weather be for the Inland Northwest?

By now you have likely heard that this is going to be a wet and warm remainder of the week across the Inland Northwest. This wet spell of weather is expected to continue into early next week. So why is this? Well, most of it can be attributed to yet another atmospheric river event. While most atmospheric rivers come and go, this event will be a little different, as we will likely be impacted by a trio of rivers. The first arrived yesterday into last night. The next is expected to unleash its torrent of moisture on Friday and the last will likely impact the region on late Sunday. The video below shows the expected sequence of events. The atmospheric rivers are denoted by the blue, purple and red colors


So what does this mean for the area. Well, it will translate to several things. The most obvious is it will result in very wet weather. Here's the estimated rainfall we are forecasting between today and Sunday night.

Rainfall forecast between today-Sunday night
These are some pretty hefty totals. Notice the reds and oranges spread across the Cascade Crest and extreme northeast Washington/north Idaho. These locations could potentially amass a few spots of 3-6" of precipitation, most of which will fall as rain. While these amounts are impressive, the question is just how rare are they? We get atmospheric rivers all the time this time of year. Certainly it can't be that unusual, can it? Well, if put into perspective for the time of year and amount of precipitation it actually turns out to be a very rare event. One of the new tools in our weather toolkit consists of quantifying an event based on climatology. In other words, how common is a weather event for a given time of year? For this event, we will look at the amount of rainfall expected over a 3-day period (between today-Sunday). Below you will see an image from one of our ensemble models showing the approximate amount of precipitation (black contours or isohyets) combined with the rarity of the forecast amount (the color shading). What's interesting, in this case, is northern California is covered with isohyets in excess of 3 inches, while over the Inland Northwest we see a small area of 1.5"-2+"  inches over extreme northeast Washington and north Idaho (the amount is smoothed and will not catch the locally higher amounts we forecast over the mountains). Despite the lighter rain totals over our neck of the woods, it's actually a less common event as shown by the blue and dark green shading. The blue shaded areas are locations where this event places in the 99.9 percentile (or 1 out of 1000 events)  for all rainfall events between December 22 and March 22nd (between 1985-2012). The dark green shaded areas, which cover a good portion of the Inland Northwest represent a 99.5 percentile event (1 out of 500 events). So technically speaking we will experience the most unusually heavy precipitation in the western US this weekend.
Ensemble precipitation forecast (Thu-Sun) combined with the relative rarity of the amount.
The other unusual weather phenomena we are expecting this weekend will be the warmth. If we once again choose to utilize a percentile ranking of the warmth for this event it's rare, but nowhere close to as rare as the rainfall. Here's a look at the forecast temperature and the respective percentile (for the period between January 27-February 17)  for the temperatures at 850 mbs (around 4500' above sea level) on Friday afternoon. The image below is showing temperatures in the lower to middle 40s (4-6°C)  pale yellow which indicates roughly the 90th percentile (1 out of 10 events). So really it's not rare at all. Temperatures at this level will be significantly cooler than what we experienced on the 25th of January when our 4500' temperature surged into the lower to middle 50s.

Climatology rarity of 850 mb temperature for Friday afternoon (2/6/15)
What will make this an unusual event though is the duration of the mild temperatures. Right now for the Spokane area we are forecasting 4 consecutive days of high temperatures right around 50° (see image below). The last time we saw that many 50°F or warmer days between December and early February (2/10) was in 1963! The longest stretch on record is 6 days set in 1917. A 3-day stretch of low-temperatures of 40°F or warmer is also rare for this time of year. Between tonight and Saturday night, we are forecasting lows at or above that mark. Surprisingly, the last time we saw three nights of lows ≥ 40°F was earlier this winter (in early December). Before that, we had only seen 3 or more consecutive nights of 40°F or warmer lows 7 times since 1881.
7-day outlook for the Spokane area Thursday (on left) through Wednesday (right)
Just the latest chapter in what has been an unusually mild and relatively snow-free winter.