Sunday, December 31, 2017

Top Weather Events of 2017


As 2017 comes to a close, let's take a look at the weather of the past calendar year. The year began with a cold and snowy January. Then, spring was marred by flooding and landslides. Our summer featured long periods of dry weather with many smoky days during August and September. The fall was relatively quiet followed by a couple of big winter storms during the second half of December.

This chronological list takes a look at ten or the Inland Northwest's top weather events of 2017.


#1. The Central Washington and Palouse Blizzard of Jan 10, 2017 is the first on our list. Drifting snow closed several highways and left cars stranded over portions of Douglas and Grant counties.


#2. The Central Washington Ice Storm: January 17-18. Freezing rain coated the I-90 corridor from Snoqualmie Pass to east of Moses Lake with more than a half inch of ice.


#3. February Ice Jam Flooding. The St Joe River, the Grand Ronde River, and several other creeks and streams in Spokane and Shoshone counties experienced ice jam flooding. Arctic cold in January gave way to heavy rains in February. The subsequent ice jams caused flooding and threatened to damage bridges in southeast Washington and the southern Idaho Panhandle.


#4. March Flooding. Above average rain on top of a deep snowpack pushed many rivers in Idaho and Washington above flood stage. Sprague Washington experienced weeks of high water as the creek entering town flooded fields and streets.


#5. April Landslides. Record amounts of precipitation over the winter combined with the release of frost in our soils caused landslides over the steep terrain of Washington and Idaho.


#6. Number 6 on our list of Top Ten Weather Events of 2017 actually features a day of beautiful weather. During a summer plagued by wildfire smoke and grey skies, eastern Washington and north Idaho enjoyed perfect conditions for viewing the solar eclipse.


#7. Camas Prairie Thunderstorm Wind. Residents of the southern Idaho Panhandle will likely remember number 7 on our list of Top Weather Events of 2017.  Back to back days of damaging thunderstorm winds hit the Camas Prairie on August 29 - 30. Trees were damaged and lightning sparked wildfires.


#8. September Smoke. Number 8 on our list of Top Weather Events of 2017 is a period of weather many of us would like to forget...the wildfire smoke. Cough!  Smoke flooded the Inland Northwest on Labor Day and lingered for the next 4 or 5 days. Spokane experienced some of the worst air quality on record during the first week of September. 


#9. Spokane Record Dry Streak. Our winter and spring featured record amounts of precipitation. Mother Nature did an about face during the summer. From June 29th through September 16th, the Spokane International Airport received no measurable precipitation. 80 consecutive dry days...a new record. 


#10. Heavy Wet Snow: December 19th. A big dump of heavy wet snow rounds out or list of Top Weather Events of 2017. For residents of Sandpoint, Bonners Ferry, and Naples, this storm is still fresh in your memory.  Bonner, Boundary, and Pend Oreille counties receive a foot of heavy wet snow.


Saturday, December 23, 2017

Christmas Eve/Christmas Day snow update

For those hoping for more snow by Christmas morning, we have good news for you.   Are you traveling on Christmas Eve?  When will the snow start?   And how much will it snow?  Let's get started!

TODAY (SATURDAY):

For today (12/23) we are under a dry northerly flow ushering in colder air to the region.  The next system is approaching off the coast as shown below

12z/23rd GFS model forecast of 500mb heights and 700-500mb Relative
Humidity valid 21z (1 PM PST) this afternoon (12/23)

TOMORROW  (CHRISTMAS EVE):

The offshore system begins to spread clouds into the Cascades tomorrow morning as shown below before precipitation begins to spread east in the afternoon and evening.

12z/23rd GFS model forecast of 500mb heights and 700-500mb Relative 
Humidity valid 18z (10 AM PST) Sunday (Christmas Eve)
MONDAY  (CHRISTMAS):

Light snow Monday morning will become focused mainly across SE Washington into North Central Idaho Christmas afternoon.

12z/23rd GFS model forecast of 500mb heights and 700-500mb Relative 
Humidity valid 21z (1 PM PST) Monday (Christmas)

So, have travel plans for Christmas Eve or Christmas Day?  Let's take a closer look at our forecast of snow amounts each 6 hours to get a better idea of when snow will start, and then end.

Sunday (Christmas Eve) Snow amount

4 AM-10 AM

Dry conditions across Central and Eastern Washington into north Idaho.

10 AM-4 PM

Snow spreads into the Cascades and much of Central Washington Sunday afternoon.

4 PM-10 PM

Snow continues to spread northeast, reaching the Spokane/Coeur d'Alene area Sunday evening but with the higher snow intensities around Wenatchee, Yakima, Tri-Cities, and Lewiston.

Christmas Day snow amount

10 PM Christmas Eve - 4 AM Christmas 

Snow over nearly all of the area, except possibly near the Canadian border.  Highest snow intensities over the Palouse, Lewiston-Clarkston Valley, Blue Mountains, and Camas Prairie.

4 AM - 10 AM 

Snow begins to decrease Christmas morning, but still a chance of light snow over most areas.  Steady accumulating snow continues over SE Washington into North Central Idaho.

10 AM - 4 PM

Dry conditions over most of Central, NE Washington, and into the north Idaho Panhandle during Christmas afternoon.

So, how much are we expecting?  Here is our forecast as of 2 PM December 23rd.


The previous blog discussed model uncertainty leading to lower confidence in snow amounts.  Models have come into better agreement, although the European model would support slightly lower amounts than what our current forecast shows.   Snow amounts will continue to be updated as this event evolves.  Please see our web site for the latest forecasts, and winter weather highlights found here

Thursday, December 21, 2017

More snow by Christmas?

Are you hoping for a White Christmas this year?   Is more snow on the way?  We'll examine this further in this blog, so lets get started.

When talking White Christmas, it's always good to see who has snow, and who doesn't.  Here is this morning's modeled analysis...

NOHRSC modeled SWE (Snow Water Equivalent) valid 17z (9 AM PST) Dec 21st, 2017

As of today (Dec 21), areas along the East Slopes of the Cascades, northern valleys, and into the Idaho Panhandle had snow on the ground while across much of the Columbia Basin, Spokane area, Palouse, and Lewiston-Clarkston Valley snow cover was spotty or non-existent.  The weather pattern ahead will be cold and thus areas with snow on the ground now look good for a White Christmas.

But what about more snow opportunities you ask?  There will be two more opportunities.  The first arrives tonight into Friday with the bulk of the moisture hitting the Idaho Panhandle, Blue Mountains, Palouse, the Lewiston-Clarkston Valley, and the southern Columbia Basin.  Here is our forecast snowfall as of 2 PM today.

NWS snowfall forecast issued 2 PM Thursday, valid through Friday

Cold and dry weather is expected Saturday, before the next system arrives Sunday (Christmas Eve).
Here is one model solution (GFS) showing an increase in moisture moving across the area on Sunday.

12z/21st GFS model run of 500mb heights & 700-500 mb Relative Humidity valid 18z Sunday (10 am PST)

This solution would bring widespread light to moderate snow accumulations for all of Central and Eastern Washington into North Idaho giving all areas a White Christmas.  However as of this writing quite a bit of uncertainty remained with how much this system will hold together as it passes through.  A different model (European) takes the system further south mainly into Oregon, clipping southern Washington and the Lewiston-Clarkston Valley.

To further convey the uncertainty, ensemble forecasts can be used which is a set of forecasts run with slightly different initial conditions to see what range of outcomes exist.  Here is one ensemble forecast (GEFS) showing snow accumulations for Spokane.

EMC's GEFS plumes for snow at KGEG (Spokane Airport) from 12z/21st December run
This shows most solutions giving Spokane a dusting of snow early on the 22nd (Friday), followed by a second and more significant round of snow on the 24th (Christmas Eve) possibly extending into early Christmas Day.  But note the spread in amounts.  The solid black line is the average which shows about 2 inches, with most members in the 1 to 2.5 inches range.  Stay tuned to the latest forecasts on our web site found here

In general, a combination of snow on the ground now in some areas combined with the potential for more snow Friday and again Christmas Eve should give most locations a White Christmas this year.

Thursday, October 5, 2017

La Nina - are you coming back?

Will we have another La Nina winter?  Many of you remember last year's La Nina winter that brought cold and snowy weather with several bouts of ice.   The Climate Prediction Center issued a La Nina Watch on September 14th and the next update will be issued on October 12th.  The latest updates on La Nina can be found here.

So why does La Nina impact the Inland NW?  Colder water in the Pacific Ocean along the equator from the west coast of South America to the dateline suppresses thunderstorms while over Indonesia warmer water results in more thunderstorms.  The wind and convection patterns in these areas impact the jet stream in the mid latitudes.   How is the jet stream different?  See map below


Typically, a common feature of a La Nina is amplified high pressure in the eastern Pacific resulting in a colder northerly flow over western Canada into the northwest.  Meanwhile the pacific jet stream brings in storms from the west.  Colder air plus the moisture equals increased odds for above normal snowfall in the lower elevations.  The NMME (National Multi-Model Ensemble) that was issued in September agrees with this:

NMME Temperature anomaly forecast for Dec 2017-Feb 2018
NMME Precipitation anomaly forecast for Dec 2017-Feb 2018
So since the models are showing a wet winter and possibly colder than normal, can we bank on it?  Unfortunately climate models aren't good enough yet to confidently believe them months out.  But still we can look back at previous La Nina events to get an idea of what historically happens.  If we average snowfall for all La Nina years, this is what we get...

Average snowfall for La Nina (inches)

If you are interested in more snowfall maps related to La Nina and how these numbers compare to normal, check out our La Nina briefing page found here.

So should we expect 59" in Spokane, 29" in Wenatchee, and 22" in Lewiston this winter?  While these are the averages, it doesn't show the variability that occurs with each La Nina.  Let's examine 3 cases of La Nina since 2005 and see what happened

2016-2017 La Nina
Many remember last winter.  It was a cold and brutal winter, and snowy with several episodes of freezing rain for many.  It was the 6th coldest winter on record for Ephrata, WA.  Blowing snow on January 10th created very high snow drifts for portions of the Waterville Plateau into Grant County in the Columbia Basin leading to road closures.  See picture below.

Photo courtesy of Grant County Sheriff Tom Jones
Spokane recorded 14 days of freezing rain or freezing drizzle.  The classic La Nina pattern set up with our area influenced by both the Polar Jet Stream and the Pacific Jet Stream for much of the winter.  Although the Pacific Jet Stream was aimed a bit further south compared to normal across southern Oregon and northern California where the wettest conditions were observed.  Here is how last winter finished.


The winter was especially colder than normal across the Columbia Basin where snow stayed on the ground for most of the winter.  For Lewiston, 39.2" fell making it the snowiest winter recorded since 1968-69.  For Spokane 61.5" fell, close to the La Nina average.

2008-2009 La Nina
This was an unusual winter. A little colder than normal in the Columbia Basin with close to normal precipitation for most.  So why was it unusual?  Who remembers?  Well most of the winter wasn't that bad, except for a three week period which was historic for Spokane and nearby communities.  If you were in Spokane from December 17th through January 5th, I'm sure you didn't forget.  A total of 74" fell in 3 weeks with several roof collapses.  An impressive 2 feet fell in Spokane in about 30 hours on Dec 17th and 18th.   Here are a couple snow pictures during this three week period, including one from downtown.

Downtown Spokane - Photo courtesy of Kerry Jones
Photo courtesy of Spokesman Review
Here is how the final maps ended up.


Except for below normal temperatures in the valleys, these maps don't look that bad.  What is the screaming message you ask?  Even if the winter as a whole finishes close to normal, you can't rule out a brief period of extreme winter weather.  Be prepared!

2005-2006 La Nina
This La Nina was slightly warmer than normal (about 1 degree) but was very wet with precipitation 130-150% of average for most.  With the milder temperatures this meant less snow for most lower elevations.  Wenatchee only got 6.9" for the winter with Spokane at 27.3". 


As you can see, every La Nina is different.  There is a delicate balance between the polar jet and the pacific jet with each of these impacting our weather.  Precisely how these set up over this winter is unknown at this time.  But historically, La Nina brings increased odds for above normal snowfall especially in the valleys.

Since this may be the second La Nina winter following a strong El Nino winter, we went back and looked at five analog years since 1950 where this occurred.  What happened in these cases with the second La Nina?


As you can see, a tendency for cooler and wetter conditions, typical of La Nina.

Finally, we'll leave you with the latest winter outlook from the Climate Prediction Center

CPC winter outlook for December 2017-February 2018 issued September 21st, 2017

Equal chances for temperatures and slightly elevated odds for wetter than normal conditions.

Thursday, September 7, 2017

Is the Smoke of 2017 worse than 2015 or 2012?

It is 10 PM on Thursday, September 7th. The city of Spokane and the rest of the Inland Northwest remain cloaked in thick wildfire smoke. As we discussed in the blog yesterday, this is not the first time this summer that smoke has blocked our views of nearby mountains or caused residents to close their windows to prevent the smell of smoke from entering their homes. Many long-time residents of our region are asking, "Has the smoke ever been this bad?".  Within the last couple of days, several local television stations and newspapers have discussed this topic. Their stories have referenced measurements from air quality sensors with comparisons to wildfire events in 2012 and 2015.

Let's take a closer look at how our current situation compares to 2012 and 2015.  We will examine visibility as a correlation to smoke "thickness" and look at visible satellite images to determine the extent or volume of smoke.

Visibility: For the thickness of the smoke, let's look at visibility sensors at a few airports in central and eastern Washington. Airports measure visibility because horizontal visibility is extremely important for pilots and air traffic controllers. These sensors measure the horizontal visibility in miles. On most summer days, the horizontal visibility in the Inland Northwest is well over 10 miles. On clear days, mountain ranges 30 to 50 miles away are very easy to see. Visibility reductions to 6 miles are somewhat rare during the summer months and are usually caused by smoke or wind-blown dust. In the summer, visibility reductions to 2 miles or less (without precipitation present) are very rare, and are usually limited to locations in the immediate vicinity of a wildfire.

For this blog, we are going to use visibility restrictions to 2 miles as a benchmark for being a "Bad Smoke Day". The picture below is an example of of 2 miles visibility.

Wenatchee Airport Visibility:  This picture is from a web camera at the Wenatchee Pangborn Airport early in the afternoon on September 7, 2017 (Today). The visibility sensor at the airport was reporting a horizontal visibility of 2 miles at this time. On a clear day, the Cascade Mountains would be easy to see behind the airplane and airport buildings. Looking at Google Earth, the foothills of the Cascades are about 4 to 7 miles west of the runway.

2012 Versus 2017: Wenatchee


The summer of 2012 featured the "September of Smoke" in Wenatchee, WA.  An extended period of dry weather with light winds allowed smoke to flood the Wenatchee and Columbia River Valleys during most of September and parts of October. The smoke largely came from several fires that comprised the Wenatchee Complex south and west of Wenatchee. The worst stretch of smoke occurred from the evening of September 12th through September 23rd. For 12 consecutive days, the visibility at the Wenatchee Airport was 2 miles or less for many hours each day. There were some short windows of improved visibility during those 12 days, but there were very few observations during this stretch when the visibility improved to 5 miles.

How does the summer of 2012 in Wenatchee compare to this summer so far? Check out this graph. Keep in mind that the worst smoke in 2012 occurred from mid to late September, and we are only one week into September 2017. Smoke or haze was occasionally reported at the Wenatchee Airport into late October.


For Wenatchee, the summer of 2012 was horribly smoky. The fires of 2012 were much closer to the city than the fires of 2017...at least for now. Check out a couple satellite images from September 2012.

September 13, 2012: The visibility in Wenatchee was at or below 2 miles for much of the day on September 13th as smoke from the Wenatchee Complex south and west of town filled the Wenatchee and Columbia River Valleys.

September 19, 2012:  A plume of wildfire smoke can be seen streaking across central Washington from the Wenatchee Complex.
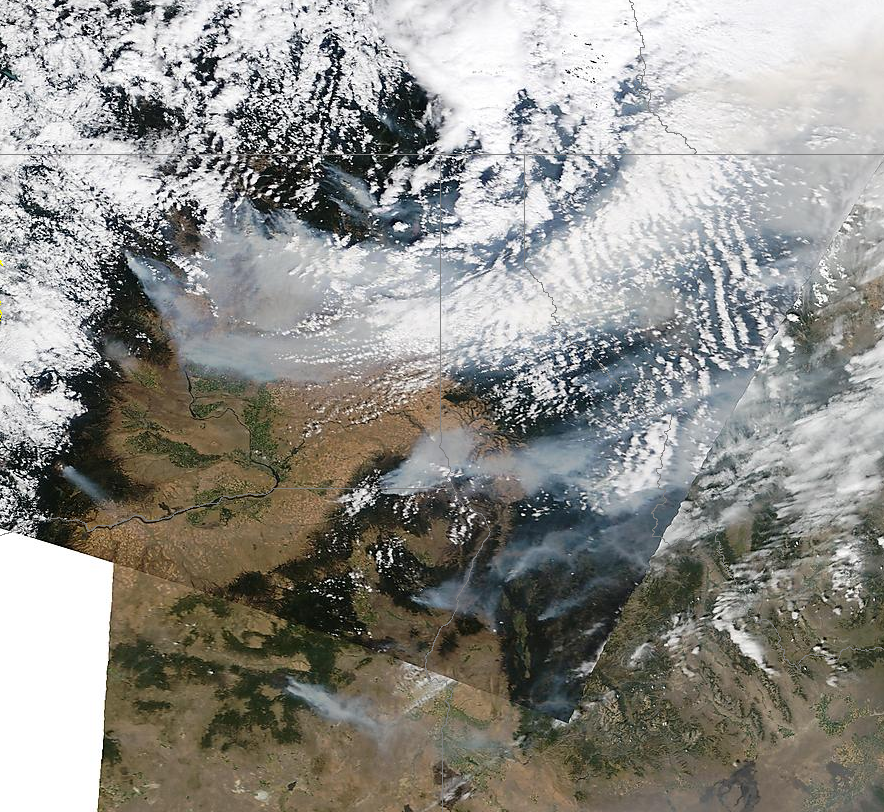
Now, compare the 2012 images (above) to the visible satellite image from yesterday -- September 6, 2017 -- below. There is no comparison in the volume of smoke!!!  In 2012, the wildfire smoke that impacted Wenatchee was more localized. Yesterday's satellite image shows thick smoke over all of Washington, Oregon, Idaho, and most of western Montana. This year there are many more large fires contributing to a much larger area of thick, thick smoke.

September 6, 2017: This visible satellite images shows thick smoke over the entire Pacific Northwest.
2012 vs 2017 Conclusion (so far): At least for Wenatchee, the summer of 2012 was worse than 2017 has been in terms of smoke duration. However, there have been at least two or three smoke episodes in 2017 that have covered much larger portions of Washington than in 2012.

2015 Versus 2017:  Spokane

The August 21st "Smoke Storm" in 2015 produced a wall of thick smoke that invaded the Spokane Metro area. The visibility in the city rapidly decreased from over 10 miles in morning to less than 2 miles in the mid afternoon into the evening hours. The smoke originated from several fires in central and northeast Washington including the Wolverine Fire (Lake Chelan), the Okanogan Complex (near Omak), and the Carpenter Rd Fire (Hunters WA). Northwest winds of 15 to 20 mph behind a cold front were responsible for directing the wall of smoke into Spokane. Check out the visible satellite image below. Look how the northwest winds funneled smoke from 3 large fires into the metro.

August 21, 2015:  The Wolverine Fire near Lake Chelan, the Okanogan Complex near Omak, and the Carpenter Rd Fire near Hunters WA produced a concentrated smoke plume that decreased the visibility in Spokane to 1.25 miles.
Our current smoke episode (Sep 4 - 7) has produced a much longer period of visibility less than 2 miles. At 9 PM Sep 7th, the Spokane Airport had experienced 79 consecutive hours of 2 miles.  The 2015 "Smoke Storm" only produced 6 total hours of visibility less than 2 miles. Our current episode has also produced visibility reductions as low as 1 mile at the International Airport compared to 1.25 miles in 2015.


Was the 2015 "Smoke Storm" an isolated occurrence of smoke that summer? It was not. The summer of 2015 had 31 days with visibility reductions of 6 miles or less due to smoke or haze. The summer of 2015 set records for the number of acres burned in the state of Washington with large fires in Chelan, Okanogan, Ferry, and Stevens Counties. With all of the fires, smoke and haze was common in Spokane as early as June in 2015.

2015 vs 2017 Conclusion: In comparing the 2015 "Smoke Storm" to our "Labor Day 2017" smoke event, 2017 has easily had the bigger impact. Not only have we experienced a lower visibility with our influx of smoke in 2017 (1 mile visibility versus 1.25 miles), but the duration of smoke has been much greater. Spokane has been going on 4 days of visibility at or below 2 miles in this ongoing smoke event. The 2015 "Smoke Storm" only produced 6 hours. Will the 2017 season equal the number of smoke days (6 miles or less) in 2015? Let's hope not.

Outlook:  Increasing west winds on Saturday (Sep 9) should help clear some of our smoke from the Inland Northwest. However, widespread rains are not expected anytime soon. Without decent rains, smoke will likely return. The wildfires of 2017 have certainly surpassed 2012 and 2015 for flooding the Pacific Northwest with a volume of thick (less than 2 mile visibility) smoke. We will see if the smoke will linger well into September or October to rival the summers of 2012 or 2015 for total number of smoke days.

Wednesday, September 6, 2017

The Smoky Summer of 2017


The summer of 2017 will be remembered as one of the smokiest in memory for many residents of the Inland Northwest. So far this summer, our region has had three main smoke events.

Event 1:  August 1st-13th -- Smoke from British Columbia.

In early August, large wildfire complexes in British Columbia were the primary source of smoke for Washington and north Idaho. Several days of north winds pushed wildfire smoke from Canada into the Inland Northwest. By Aug 3-4, much of the Inland Northwest was shrouded in wildfire smoke. This smoke would linger through the weekend of Aug 12-13 when a cold front finally pushed the smoke out of our region.


August 1st:  This "True Color" visible satellite image is from the morning of August 1st. Look at thick smoke in southern B.C. pour into north central Washington through the Okanogan Valley.

August 4th:  By the 4th, smoke covered most of the state of Washington as well as large portions of Idaho, Oregon, and Montana.
Event 2:  August 22nd - 30th -- Smoke from Oregon.

In late August, the Inland Northwest received smoke from a different source region. This time large fires in southwest and west central Oregon produced a thick layer of mid and high level smoke that periodically moved across Washington and north Idaho. During this nine-day event, smoke largely remained aloft, but there were periods when places like Lewiston, Pullman, and Spokane experienced visibility reductions to 5 miles or less.

Aug 22nd: This late afternoon visible satellite image shows thick smoke over southwest and west central portions of Oregon. Between August 23rd and 30th, mid and high level smoke from Oregon would produce periods of hazy and smoky conditions over much of the Inland Northwest.

Aug 30th: For most of eastern Washington, North Idaho, and central Oregon, the worst day of smoke in late August occurred on the 30th prior to the arrival of a cold front. In Spokane, the visibility dropped to 5 miles shortly after sunrise on the 30th.

Event 3: Sep 4th - 8th  -  Smoke from Montana + Washington Cascades + Oregon

Our ongoing smoke event has been the worst so far this summer. The arrival of a cold front on Labor Day (Sep 4th) imported thick ground level smoke from Montana into our region. In addition to the thick low level Montana smoke, fires in the Washington Cascades and Oregon added a good deal of mid and high level smoke over the Pacific northwest.

With widespread visibility of 2 miles or less in Washington, Oregon, and Idaho...our ongoing smoke event is the worst so far. It will likely be late Thursday or Friday before "cleaner" west winds push smoke out of the Pacific Northwest.

Sep 6: Milky white smoke covers all of Washington, Oregon, Idaho, and much of western Montana in this "True Color" visible satellite image from the afternoon of September 6th.

Tomorrow evening, we will compare our ongoing smoke event (Sep 4th - 8th) to the Spokane "Smoke Storm of August 2015" and Wenatchee's "September of Smoke in 2012".