Tuesday, September 23, 2014

2014 Open House

Saturday September 20th was a Glorious Weather Day as the National Weather Service in Spokane held our 5th Open House event hosting the general public at our facility in Airway Heights. Around 300 guests visited between 10 am and 4 pm and were treated to a number of displays, presentations, events and fun activities.


The Open House was truly that, allowing the guests to roam freely thru most of facility. Staff were on hand in all areas to meet, greet, conduct demonstrations and answer questions. Informative displays explained many of the issues and subjects the NWS deals with on a daily basis. A tented area allowed for added space for more displays and a presentation mini-theater.

Upon entering the front door guests were greeted by Admin Assistant Rose Tibbitts who asked guests to sign in and then explained the overall set up and general flow of the event.


The conference room was turned into a display area with posters, pictures, a presentation on the 2014 wild summer weather and a weather quiz. Do you know the hottest temperature ever recorded in Washington?


The Operations Area was set up so that the normal forecast and observation functions could continue uninterrupted, while guests could interact with a forecaster at an AWIPS workstation. Forecaster Steve Bodnar manned the AWIPS workstation for most of the day explaining how we formulate and issue our forecasts and warnings.


Guests then walked into the Electronics Shop where Electronics Systems Analyst Dwight Williams explained the various system he and the El Techs maintain and repair. Displays on the Doppler Radar, ASOS, NOAA Weather Radio and the Cooperative Observation Program were featured in this area. 


Then it was outside to the tented area for some special displays and events! The Kids Activity Area is always a big hit at our Open House Events. The kids could conduct the Rain Gauge Experiment, see the Cloud-in-a-Bottle, make a Wind Sock, Learn about Lightning Safety and more! Forecasters Robin Fox and Laurie Nisbet lent their tireless energy to this active part of the tour.

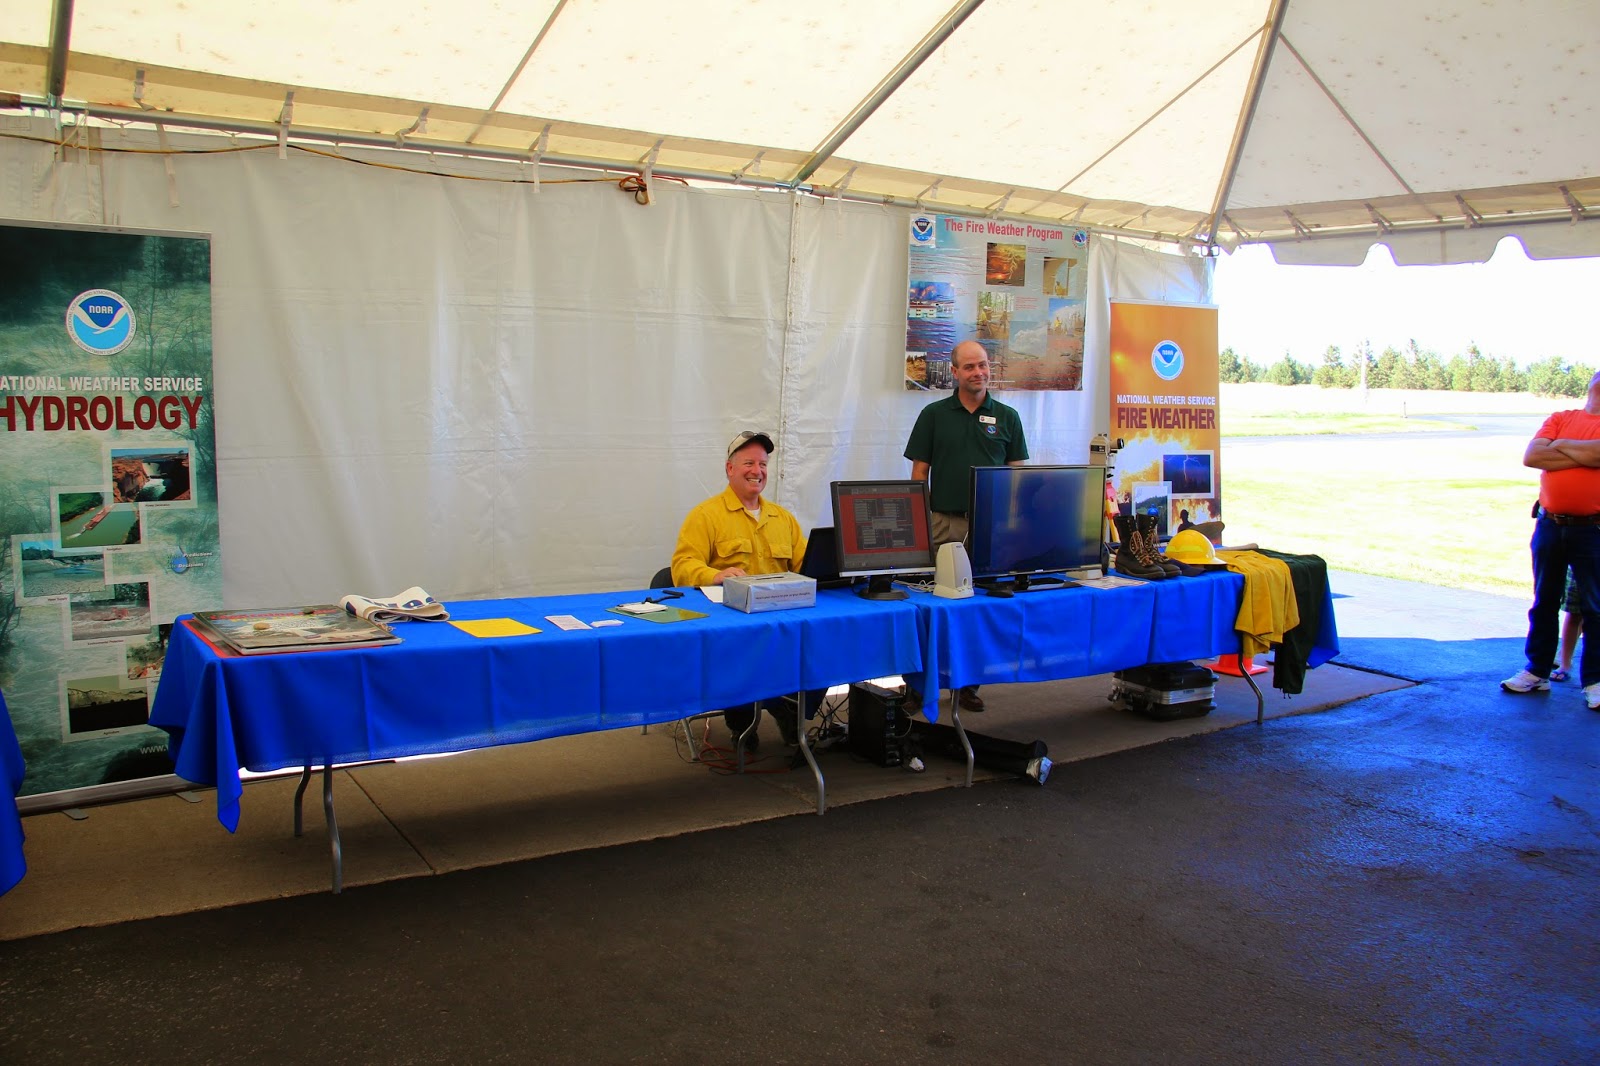
Service Hydrologist Katherine Rowden staffed the Hydrology Table again, giving demonstrations with the large Flood Plain Model. Adjusting the flow from the 2011 Open House, the demonstration was done at set times allowing Katherine to stay relatively dry. She also had information on the office Hydrology Program and the recent Burn Area Emergency Response team work she participated in for the Carlton Complex Fire.


Speaking of Fire, Incident Meteorologists Jon Fox and Todd Carter donned their Nomex clothing and staffed the Fire Weather table. They had videos, handouts and a wealth of knowledge on how we become part of the Incident Management Teams that manage wild land fires.
  

Also in the tented area was a mini-theater were presentations were done. Scheduled at various times during the day subjects included "The NWS, Who We Are and What We Do", "Volunteer Observers" and "The Winter Outlook". Science Officer Ron Miller lent his expertise to the presentation on what we expect for this upcoming El Nino winter. 


A Special Presentation was done just before noon as Meteorologist in Charge John Livingston presented Nancy Taylor of Lacrosse WA with the Thomas Jefferson Award. Mrs. Taylor is a Cooperative Observer, taking a once-a-day observation of temperature, rainfall and snowfall. She received the award for her years of dedicated service. This is the highest award given by the NWS Cooperative Observer Program and one of five given across the nation in 2014.


The Event concluded with the 4 PM Weather Balloon Launch. Always a popular part of the day, Observations Program Leader Mark Turner gave folks an idea of why we still release weather balloons with instruments attached, how far they go, where they end up, and then answering all the other questions that people ask about this program.


Thanks to all who came out to our 2014 Open House and if you missed it, look for announcements for our 2016 Event in about 2 years!


Friday, September 19, 2014

Was this the hottest summer ever?

Some of you may have heard that this was the hottest summer ever in the Inland Northwest.  This strong statement may have been inferred from the statistics put out by the National Weather Service office in Spokane.  So let's take a look and see if this is true.

First, we need to define summer.  The calendar says that summer is from June 21st to September 21st.  But this is astronomical summer, which is defined as the longest day to the autumnal equinox.  This doesn't have anything to do with summer.  Another definition is meteorological summer, which is just the 3 months of June, July and August.  But if you've lived in the Inland Northwest for awhile, you know that June is most definitely not a summer month.  It can have glimpses of summer, but consistent warmth is rare.  So we typically define summer as Independence Day to Labor Day, or more simple, July and August.  Yes, that's right, there's only about 2 true months of summer in our corner of the world.

So now let's look at the numbers. Here's the average temperature for July and August.

Average Temp
Spokane
Lewiston
Wenatchee
2014
74.0°F
78.5°F
77.5°F
Record
73.5°F (1998)
78.5°F (1939)
77.6°F (2004)
Normal
69.5°F
74.7°F
74.7°F

Sure looks like 2014 was indeed the hottest summer ever.  But before we pass judgement, lets look at another measure of summer.  We typically track the number of days that reach 90°F or hotter.  Why?  Because one really cool day can offset 3 hot days when you average them together.  Counting 90°F days measures how many days were truly hot, regardless of how cool the other days were.  So here's the numbers:

Number of 90+F Days
Spokane
Lewiston
Wenatchee
2014
27
47
39
Record
39 (1958)
80 (1938)
56 (1970)
Normal
18
44
33


These numbers seem to tell a different story.  Yes, there were more 90+°F days than normal, but they are far from the record levels.  In fact, in all 3 cities, the number of 90+°F days in 2014 is actually less than 2013.

So which is right?  Was it a record hot summer, or just a bit hotter than normal?  The answer lies in the definition and calculation of "Average" temperature.  The average temperature is an average of both the max and min temperature.  So lets see the numbers for the max and min separately.

Average Max Temp
Spokane
Lewiston
Wenatchee
2014
87.2°F (tied 5th)
93.6°F (13th)
90.6°F (13th)
Record
88.5°F (1998)
96.1°F (1939)
92.5°F (1971)
Normal
83.5°F
89.5°F
88.2°F


Average Min Temp
Spokane
Lewiston
Wenatchee
2014
60.8°F (1st)
63.4°F (1st)
64.3°F (tied 2nd)
Record
59.6°F (2013)
62.7°F (1990)
64.4°F (2004)
Normal
55.5°F
59.8°F
61.2°F


There's a lot of numbers here.  The thing to notice is that for the Max Temperatures, this summer wasn't the hottest.  It was hot, well above normal, but not the hottest ever.  But when you look at the Min Temperatures, you find out that this was the warmest summer ever for Spokane and Lewiston, and the 2nd warmest for Wenatchee.  What gives?  Why were the Min Temperatures so warm this summer?

Turns out, it's not just this summer.  Let's look at the warmest Min Temperatures for Spokane in July and August.

Rank
Min Temp
Year
1
60.8
2014
2
59.6
2013
3
59.1
2004
4
58.5
1998
5
58.2
2007
6
56.2
2009
7
58.1
2012
8
57.2
2006
9
56.4
2003
10
56.2
1983
11
56.1
2008
12
56.0
1990
13
56.0
1994
14
55.9
2005
15
55.5
2010

Again, a lot of numbers to digest.  Notice anything unusual?  Of the 15 warmest Min Temperatures for July and August, 12 of them have occurred since 1998.  Are the summer nights really getting warmer?

One way to check this is to look at other nearby sites that are more remote.  There is a long historical record of weather observations from the Priest River Experimental Forest.  As the name implies, these are taken in a forest, far from any urban influence.    Rather than bore you with even more numbers, I'll just tell you that of the top 15 warmest Min Temps July/August at Priest River, only 2 of them are since 1998.  Some are from the 1970s, some from the 1940s.  The warmest is from 1905.  In other words, they are more random, as you would expect.

So why are Spokane summer nights so warm?  The answer is the location of the temperature sensor.  


The official NWS ASOS sensor is located in the middle of Spokane Airport.  It was placed there in 1995.  Notice all the concrete around there?  The sensor is surrounded by it.  That pavement absorbs the sun's warmth during the day, and then releases it at night.  The official sensor has been at the airport since 1947, but the airport continues to grow.  The previous location for the thermometer was north of the current parking lots, away from much of the effects of the runways.

Additionally, the late night wind at the Spokane Airport is often from the northeast during the summer.  Where is that air coming from?


That's right, the city of Spokane lies to the northeast of the airport.  So all of the urban warmth is warming the air that moves over the airport during the night.

Professor Cliff Mass has a similar analysis of the SeaTac temperatures in his blog:


So what was the cause of our hot summer, and how extensive was it?  First, let's look at the state-based ranking of temperatures for July and August.  Here's July:


The number represents the historical ranking.  Since there are 120 years in this database, the 116 for Washington as well as Idaho means that this was the 5th warmest July in the last 120 years.  Again, this uses the Average Temperature.  Parts of the central US had their coldest July ever.


As we've pointed out, August cooled down a bit.  But even so, for Washington, it was still the 7th warmest statewide.  Take a look at the other parts of the West.  Utah had it's 8th warmest July ever, but it's 15th coldest August.


For June through August, the largest anomaly was along the West Coast, although it was still above normal over much of the western US.

So what was the cause of this anomalous warmth?  Meteorologists actually pay more attention to the layers of the atmosphere well above the surface.  And the anomaly chart at 20,000 feet does a nice job of showing the cause of our heat:
500mb Height anomaly for July 1 - August 15, 2014

The "warm" colors are areas where the pressure was stronger than normal.  As you can see for the US, the largest anomaly existed over the Northwest, while a low pressure anomaly prevailed over the northeast US (they didn't have a warm summer). We usually have high pressure over the West during the summer, but this year, it was extra-strong.

The weather pattern actually shifted in mid-August.  Our weather responded by being more normal for the latter half of August.  Here's that same anomaly chart for August 16th through the 31st:
500mb Height anomaly Aug 16-31, 2014

Notice how the entire pattern has shifted.  The strong positive anomaly is now over the Gulf of Alaska, with a negative anomaly over much of the West.

So what will happen this winter?  We'll address that in an upcoming blog.