Tuesday, December 6, 2016

Snowy weather ahead!

Those that are looking for more snow, we have some good news for you!  The Inland Northwest is entering an active winter pattern with cold and snowy weather.  While we are confident of this pattern, a complex situation is developing.  Let's take a closer look at the pattern, beginning with Thursday.

00z/Dec 7th GFS model forecast for 500mb heights and 700-500mb Relative Humidity 21z THU (1 PM PST THU)
The bright green areas indicate areas of high moisture content with snow expected to develop across the region late in the afternoon or evening on Thursday.

How about Friday?

00z/Dec 7th GFS model forecast for 500mb heights and 700-500mb Relative Humidity 21z FRI (1 PM PST FRI)

The low moves closer to the region with lots of moisture streaming over cold air still in place.

And Saturday?

00z/Dec 7th GFS model forecast for 500mb heights and 700-500mb Relative Humidity 18z SAT (10 AM PST SAT)
Still looks unsettled, and, Sunday?

00z/Dec 7th GFS model forecast for 500mb heights and 700-500mb Relative Humidity 18z SUN (10 AM PST SUN)
Possibly a "relative" before another system seen here approaching the coast.

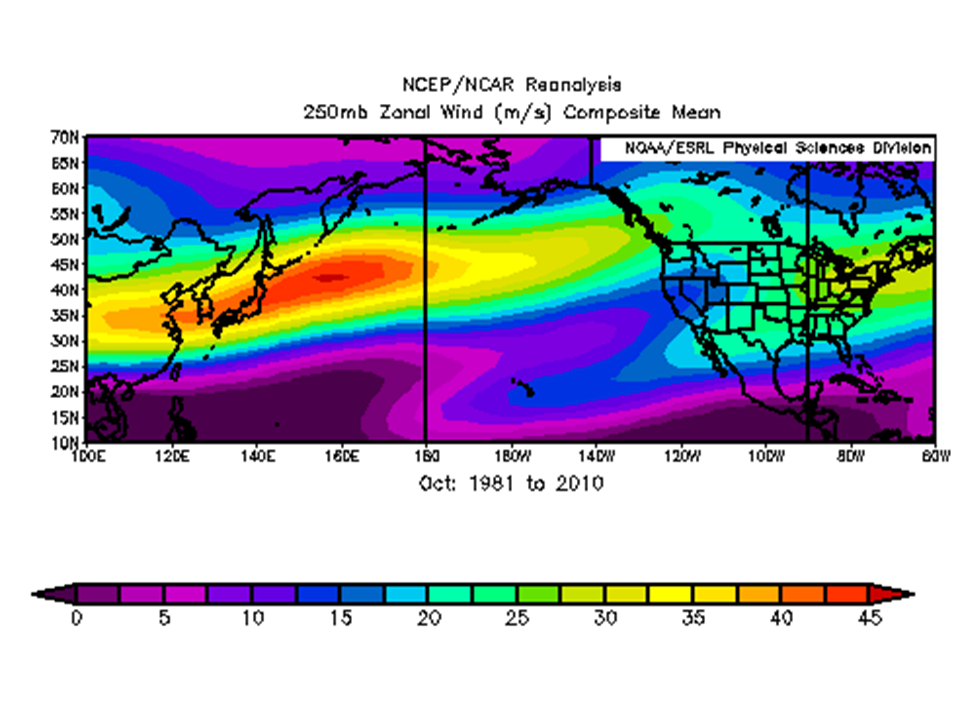
So why the prolonged period of active weather?  We are in the battleground area between the Polar Jet stream coming around a strong blocking ridge of high pressure over Alaska, and a Pacific Jet Stream.  Where the two meet equals snowy weather.  Here is one GFS model run for Sunday illustrating this complex pattern.


Would you like proof of the frigid air to our north?  Well here you go!


18Z GFS/Dec 6th forecast of 850mb temperatures and heights valid 18z SUN (10 AM PST SUN)


Given this complex pattern, just small variations in the jet stream can lead to big shifts in where the heaviest snow falls.   To help with this, we can look at the ensembles where each member makes a prediction.  In this case, we will look at the snow forecast for Spokane.

GEFS Snow accumulation forecast for Spokane WA through 4 PM Sunday.

As you can see, all solutions show snow beginning to accumulate late Thursday afternoon or evening, and show snow persisting at times at varying intensities through the weekend.  By4 PM Sunday, most solutions show anywhere from 6 to 10 inches.  However again given the complexity of this situation I wouldn't be surprised to see this range come down or up slightly.  Also this doesn't take into account compaction which can lead to a snow depth (snow on ground) not as high compared to the total snowfall.

Here is one model solution showing geographically the potential amounts of precipitation through the weekend.

00z GFS/Dec7th forecast of total qpf through 00z Monday (4 PM Sunday)

Given the westerly flow providing upslope into the higher terrain, the Cascades crest and the Central Panhandle Mountains will get hammered with heavy snow.  This solution indicates the potential for 2-4 inches of liquid translating to at least 2-4 FEET of snow along the Cascade crest and 1-2 FEET over Lookout Pass.   Travel over the mountains will be especially hazardous.

So, how long will this pattern last you ask?  Good question.  The latest CFS Model shows December as a whole finishing colder and wetter than normal, take a look.


This active winter pattern should last into next week and possibly beyond.  Low confidence of the details so stay tuned!


Friday, November 18, 2016

Active weather pattern setting up near Thanksgiving

Those that are traveling over the Thanksgiving Holiday weekend (Nov 23-27) may be impacted by several storms moving into the region.  The mountain passes will be especially impacted by snow and roads may resemble something like this...


Since this forecast period is still several days out, we will try not to get too specific with the details, but the pattern certainly looks favorable for mountain snow, which will impact travel at times over the mountain passes.  Some of the lower elevations over the Inland Northwest could see some snow as well, with colder valleys such as the Methow and up near the Canadian border most at risk.  Typical warmer spots such as near the foothills of the Blue Mountains (Pomeroy area) and Lewiston-Clarkston valley are under the lowest threat.  But again, this is still several days out so please keep informed of the latest forecasts.

So, what are the models showing?  They all show (except the Canadian model as of Friday night) an active northwest flow pattern with multiple storms tracking through beginning as early as Tuesday night and continuing through the holiday weekend.

Let's begin with the first system, arriving Tuesday night into Wednesday.  Keep in mind that Wednesday is one of the busiest travel days of the year.

Tuesday night/Wednesday:
Nov 19th/00z GFS model forecast of 500mb heights and  700-500mb RH 12z Wed (4 AM PST Wednesday, Nov 23rd)

This is the weakest of the incoming storms but will still likely produce accumulating snow over the mountain passes as it tracks through.  Valley snow (mainly above 2000 feet) is also possible depending on timing.  A morning arrival during the coldest part of the day would be more favorable for this.  Here is what the University of Washington WRF-GFS is showing.

Nov 19th/00z UW WRF-GFS 24 hour snow accumulation ending 4 PM Wednesday

This suggest the potential for 2-4 inches of snow Tuesday night into Wednesday in the mountains, and possibly light accumulations for the northern valleys as well.  Keep in mind this is still several days out so precise locations and amounts will probably change in the models between now and then.

Thursday (Thanksgiving):
Nov 19th/00z GFS model forecast of 500mb heights and  700-500mb RH 18z Thu (10 AM PST Thursday, Nov 24th)
A stronger storm as a deep low sends a moist frontal system through the region.   Some models dig the system a bit further south and delay precipitation until Thursday night, time will tell.  Of course timing could change even more between now and then.

Friday:
Nov 19th/00z GFS model forecast of 500mb heights and  700-500mb RH 18z Fri (10 AM PST Friday, Nov 25th)
The system moves inland with continued unsettled weather.  The snow continues in the mountains, with a chance of rain and snow for the lower elevations.

Saturday:
Nov 19th/00z GFS model forecast of 500mb heights and  700-500mb RH 12z Sat (4 AM PST Saturday, Nov 26th)
Here comes the next storm.  Another moist frontal system tracks through with significant snow to the mountains, too early to call rain vs. snow in the lower elevations.


Sunday:
Nov 19th/00z GFS model forecast of 500mb heights and  700-500mb RH 18z Sat (10 AM PST Sunday, Nov 27th)

The storm moves inland and thus the pattern remains unsettled.

Now keep in mind the model forecasts are still several days out and usually don't get the precise timing and strength details correct this far out into the forecast.  The main message is that the pattern looks very active for the Thanksgiving Holiday weekend and travel impacts are a high possibility.  So keep informed of the latest forecasts before traveling this Thanksgiving.   The upcoming pattern looks very good for the ski resorts.


Thursday, November 10, 2016

Changes ahead, and La Nina advisory

This has been an unusual fall so far.  First the record wet October, then the long stretch of warm and sunny days over most of the Inland Northwest so far this November.   How much longer will the warm weather continue?  And what is new with La Nina?  Will take a look at these topics in this blog.

November warmth:

November has been very warm, with most places across the Inland NW running 7-11 degrees above normal through the 9th.  The warmth has been most anomalous on the Palouse where Pullman's average temperature is running 11 degrees above normal through the 9th.  Even more impressive warmth over the Central US.  Here is a map showing the anomalies for the first nine days of November.


Pattern change:
So how much longer will this continue?  The answer is not much longer.  An unsettled weather pattern is shaping up beginning early next week with occasional rounds of rain expected.  The jet stream will shift south of the region around Wednesday, Nov 16th  as an upper trough settles over the region.   See image below...

18z/10th GFS forecast for 500mb height and 250mb wind 00z Thursday (4 PM PST Wednesday, Nov 16th)


This will result in cooler temperatures, with highs for most towns only in the 40s!  While this is much cooler, this is more typical for mid-November.

La Nina:
Now, time to talk about La Nina.  The Climate Prediction Center (CPC) issued a La Nina Advisory today (Nov 10th) with La Nina conditions favored for this winter.   Details of the advisory can be found here.

Since our October blog (found here) focused on neutral years and confidence has now increased for a La Nina, we will take a closer look at La Nina.  Here is a map showing a pattern that often sets up during La Nina winters.


Typically high pressure sets up in the Eastern Pacific resulting in the jet stream taking aim at the Pacific Northwest from the northwest bringing periods of cool and wet conditions.  However, this jet stream position fluctuates frequently, so a cooler and wetter than normal winter is not always the case.

This is expected to be a weak La Nina, so we went back and looked at what happened during past weak La Nina episodes.

Did any common themes show up?  Let's begin with temperatures


Weak La Nina years winters tend to have near or below normal temperatures in most cases for Washington and north Idaho.


What about precipitation?


It doesn't get much worse then this!  As you can see, a lot of variability with some cases dry, others wet, while others have near normal precipitation.

What about snowfall?  Here are graphs for Spokane, Wenatchee, Republic, and Bonners Ferry for weak La Nina cases.


For Spokane and Wenatchee, lots of variability!  Looking at Spokane data, most people probably remember the recording breaking snowfall in the 2008-2009 year where 97.7 inches fell.  However the weak La Nina prior to this (2005-2006) only 27.3 inches fell.   For Republic and Bonners Ferry, most weak La Nina events bring near to above normal snowfall.

Let's look at the past two cases in more detail.  The graphs below show observed temperatures at Spokane for the past two weak La Nina episodes.


The blue lines represent observed data, while the brown area represents normal temperatures.  As you can see the 2005-2006 winter started off cold.  Snow fell in late November and early December with cold and dry conditions following through the 20th.  Then mild conditions dominated the end of December through early February.

In contrast for 2008-2009 cold temperatures settled in during the middle of December followed by continued cold but fluctuating temperatures as numerous storms brought snow to the region. Snowfall at the Spokane airport totaled 74.5 inches over a three week period from Dec 17th to January 6th!  This is what downtown Spokane looked like.

Downtown Spokane streets January 3rd, 2009.
As you can see, every La Nina year is different.  Be prepared for winter weather.

So what does the latest CPC winter outlooks show?

CPC 3 month temperature outlook (Dec-Jan-Feb 2016-2017) issued Oct 20th

CPC 3 month precipitation outlook (Dec-Jan-Feb 2016-2017) issued Oct 20th

For temperature, the outlook calls for Equal Chances (no clear indication how things will turn out).  For precipitation, slightly elevated odds for wetter than normal conditions.  These forecasts overall jive with past analog years for weak La Nina, with no strong indicators of how this weak La Nina will turn out.


Thursday, November 3, 2016

Record Wet October! And when will it snow?


What a wet October!

As most of you already know, October will go down in the record books.  In this blog we will talk about records, what caused it, and then take a look ahead as some may be wondering when it will snow.

So why was October so wet?  Let's first take a look at what usually happens in October by analyzing the jet stream.  The jet stream is a current of fast moving winds that transport weather systems across the globe.  Where is this jet stream typically in October?
October 1981-2010 250mb jet mean

 Typically, the jet streams races from west to east across the Pacific and is aimed at central and southern British Columbia.  This in turns results in wet weather for our friends north of the Canadian border, while Washington and north Idaho get occasional rounds of light rain.  So what happened this year?

October 2016 250mb jet mean
As you can see, the jet stream was displaced south, with storms slamming into Washington, Oregon, and northern California.  Also note how the prevailing jet stream while westerly, was actually coming into Washington from the southwest.  This is important as strong west to east jet stream often creates a rain shadow over much of Central and Eastern Washington.  Southwest flow often gives more generous precipitation to the region with less rain shadowing off the Cascades.

What else caused the wet pattern?

Typhoon Songda

We often don't think of Typhoon's when it comes to the weather over our region.  But in October sometimes these tropical system's can get embedded within the jet stream as they leave the tropics and re-curve into the mid-latitudes.  This is exactly what happened with Typhoon Songda (pictures above), reaching the area October 15th. The remnants of the Typhoon got picked up by the jet stream with the low center tracking over Vancouver Island.


These are the main reasons for the wet October, now let's get to the records!  These were not just over our area, but much of the west coast of North America.  Check this out!

Tweet from WRCC showing October precipitation records

This was a tweet sent out by the Western Region Climate Center (WRCC) back on Nov 1st.  Because of the southward adjustment in the jet stream that persisted during the month, areas across northern British Columbia and SE Alaska recorded the driest October on record.

So what areas specifically had the wettest on record?  Take a look...


As you can see the record wet weather extended across most of the Puget Sound region, NW Oregon, the East Slope Cascade valleys, most of Eastern Washington, and the north Idaho Panhandle.

So how much rain fell?  Here is a monthly analysis which takes into account observational data and provides an upward adjustment in the mountains.

Precipitation analysis from October 2016

Looking at the legend on the right side, anything in white is 20+ inches, pink and purple 10-20", red colors 5-10", brown and orange 3-5", with yellow around 3".  Here are some of the top wettest reports from our area.


A special thanks to all of our spotters, COOP observers, and CoCoRaHS observers for all the reports you send to us, we appreciate it!

Now finally, the most impressive record broke in October was Spokane.


As you can see, October 2016 for Spokane was the wettest month of all time, dating back to 1881.

We have talked a lot about rain, some of you may be asking when will it snow?  Well as usual this depends on where you live.  The tables below summarize when the normal first inch of snow occurs in no particular order.


Of course each year is different.  It looks like the first half of November is going to be very mild with temperatures above normal.    Here is the 8-14 day outlooks valid Nov 11-17th  issued by the Climate Prediction Center on Nov 3rd.

CPC 8-14 day temperature outlook issued Nov 3rd

CPC 8-14 day precipitation outlook issued Nov 3rd


This does not look favorable for valley snow.  We will have to wait and see if the pattern changes towards the end of the month.


Tuesday, October 11, 2016

2016-2017 Winter Outlook

Updated October 15th

CPC reissued a La Nina Watch on October 13th.  The watch stated a 70% chance of La Nina conditions this fall and a 55% chance for the winter.  If a La Nina does develop its expected to be weak.  We re-ran some maps and numbers this morning for weak La Nina years, which showed a similar story as neutral years with variability being the key piece.  If a weak La Nina develops, near to below normal temperatures are favored while precipitation remains more uncertain. The same conclusion came about in this blog when looking at neutral years.

--------------------------------------------------------------------------------------------------------------------------

Now that fall is here, many might be wondering what kind of winter will occur this year.  In this blog we'll take a look at this.

Typically each fall forecasters take a close look at the ENSO-state, whether we are expecting a El Nino, La Nina, or neither (which is considered neutral).  Large scale weather patterns are influenced by what happens in the tropics.

For this season, the Climate Prediction Center is favoring neutral conditions or a weak La Nina.  What does this mean for us?  Here is a map showing typical patterns in neutral years.

Typical winter pattern during ENSO-Neutral years


Neutral years tend to bring a wide variety of weather to the Inland NW.  The Pacific Jet Stream brings storms into the west coast, but frequency and location vary.  The polar jet stream tends to send cold air from Central Canada southeast across the upper midwest and northeast US.  However this too can fluctuate.

October looks like it will finish much wetter than normal as an active Pacific Jet Stream takes aim at Washington, Oregon, and Northern California.  Here is the latest CFS forecast with the green and blue colors over us indicating wetter than normal

CFS forecast for precipitation anomaly October 2016


Let's dig a little deeper for Neutral years.  Here is map that averages all Neutral years during the winter months for temperature and precipitation.  What does it look like?


This shows temperatures slightly cooler than normal and precipitation close to normal for the Inland Northwest.  What this doesn't show in the variability that occurs and that every neutral year is different.  Want to see this for yourself?  OK, let's start with temperature


Since 1980, there have been 14 neutral years.  As you can see, a lot of variability...

6 - cool
5 - normal
3 - warm

What about precipitation?  Same story


5 - dry
6 - normal
3 - wet

The 1950-1979 years (not shown) were also analyzed which showed a similar story.  When looking at 1950-2015 period of record, temperatures ended up near to cooler than normal most frequently (20 out of 28 cases), while precipitation showed no clear signal.  A warmer and drier than normal winter has never occurred in a neutral year.  If a weak La Nina develops this winter, this would also support a near to cooler than normal winter.

What about snowfall?  Let's look at four locations:


As you can see, variability is the rule especially for Spokane and Wenatchee.   In general, the 1996-1997 winter was a snowy one especially in Bonners Ferry where over 160 inches fell.  The 1992-1993 winter was also snowy.  Meanwhile, the 1980-81, 1993-94 winters brought much less snowfall.

So now that we have looked at history of neutral years, let's see what the outlooks from the Climate Prediction Center issued in September are suggesting.

CPC Dec-Jan-Feb temperature outlook issued Sept 15th, 2016

CPC Dec-Jan-Feb precipitation outlook issued Sept 15th, 2016

These forecasts show a similar story.  For temperature forecast is for EC (Equal chances), meaning there is no clear signal whether this winter will end up cooler than normal, normal, or warmer than normal.  For precipitation, wetter than normal is just slightly favored.

Regardless of how this winter shapes up in the long haul, the Inland NW always gets impacted by winter storms bringing wind, rain, snow, and even occasional pockets of freezing rain.  Don't be surprised by an arctic blast.  So be prepared for these storms before they arrive by keeping informed of latest weather forecasts.

Thursday, September 15, 2016

Weather changes are coming!

For those tired of this...


...weather changes are ahead!  We will have one last warm day on Friday, here are the forecast highs from the afternoon forecast issued today (9/15).


Most of the Inland Northwest has been drier than normal over the past couple months, with much needed rain on the way.  A strong jet stream will enter the region this weekend as the graphic below shows.
12z/15th GFS model depiction of 500mb height and 250mb wind speed 00z Sunday (5 PM PDT Saturday)

This system will tap into good moisture, see below.

00z GEFS Ensemble mean of Integrated Water Vapor Transport 00z Sunday (5 PM PDT Saturday)

See the yellow and brown shaded area off the Oregon and northern California coast?  This indicates a high amount of water vapor (moisture) with the winds transporting this moisture into the region.  This will produce rain on Saturday, and possibly into Sunday.  The westerly flow will result in enhanced lift along the Cascade crest and the Idaho Panhandle where the highest rain totals are expected.  Meanwhile downslope westerly winds off the Cascades into the Wenatchee area, Okanogan Valley, and Moses Lake area will produce much lighter totals.  

What are the models showing for rain totals?  Let's take a look.

12z/15th GFS, Canadian, NAM model 24 hour precipitation comparison ending 12z Sunday (5 AM PDT Sunday) 

The GFS (upper left), Canadian (upper right), and NAM (lower left) 24 hour rain totals ending 5 AM Sunday morning (9/18) are shown from the 12z model runs from September 15th.  The models suggest around 0.75-1.50" of rain near the Cascade crest, 0.25-0.50" with locally higher amounts for the Idaho Panhandle, with about 0.10-0.25" for most of eastern Washington.

After this models shows another opportunity for rain showers.  Here is what Monday looks like...

12z/15th GFS model depiction of 500mb height and 250mb wind speed 00z Tuesday (5 PM PDT Monday)

A low pressure system near the north tip of Vancouver Island with an enhanced jet stream still over the area.  Then for the middle of next week that low moves overhead for cool weather and a chance of showers.

12z/15th GFS model depiction of 500mb height and 250mb wind speed 18z Wednesday (11 AM PDT Wednesday)

The cool weather pattern may hang around through the end of next week.  Here are the 6-10 day temperature and precipitation outlooks issued by the Climate Prediction Center on September 15th.


Increased odds for cooler and wetter than normal September 21st through the 25th.
So enjoy Friday as weather changes are ahead.