Thursday, December 23, 2021

Snow then Bitterly Cold

By now, many have probably heard of the much colder temperatures arriving for next week.   These may be some of the coldest temperatures the region has experienced in at least the past 10 years.  If you haven't already, now is the time to prepare!


Before we get into the details of the bitter cold, let's briefly talk about the weather pattern going into Christmas weekend which is expected to bring snow to much of the region.

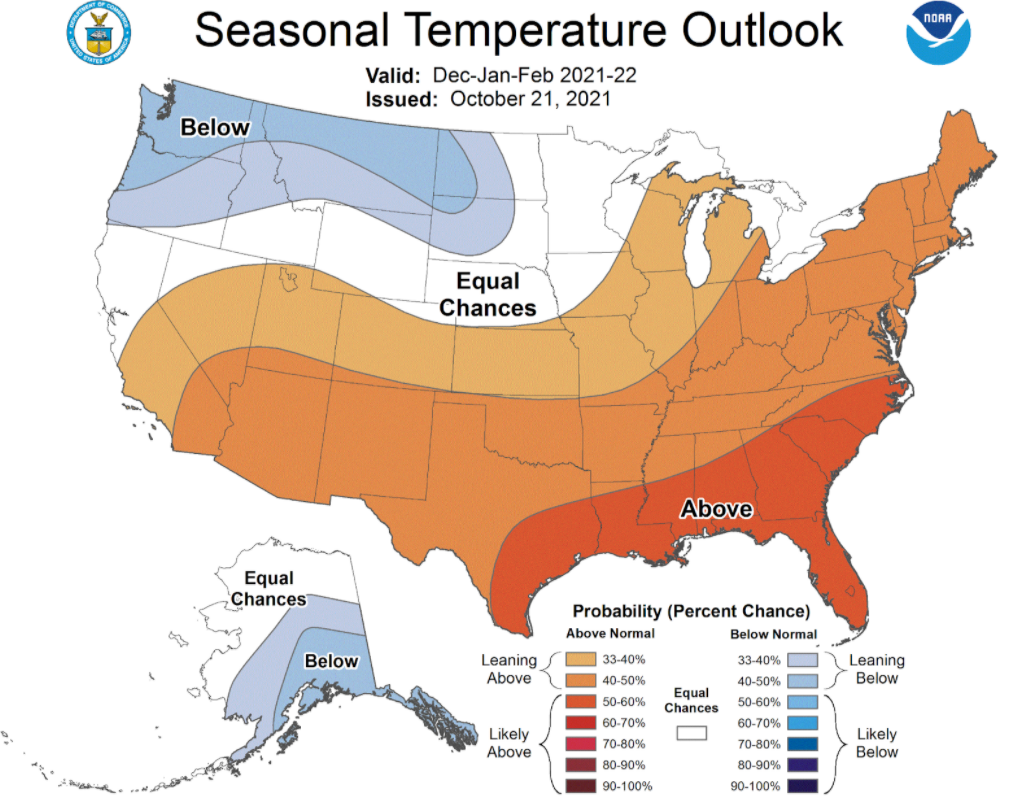
A very cold weather system will stall over the region from Friday through Monday, as shown by the dark blue colors from this model simulation showing anomalous low pressure over the region.

18z Dec 23rd GEFS forecast of 500mb heights and anomaly (shaded) valid Dec 24-27th, 2021

The cold system will result in a very unstable atmosphere, with bands of moderate to heavy snow showers each day.  Pinpointing where these set up is often difficult to predict, but can produce localized areas of heavy snow accumulations.  Right now models are showing the heaviest snow amounts over far NE Washington into the Idaho Panhandle.

But the big story continues to be the bitterly cold for next week.  

The same model as above shows the really cold stuff settling in on Monday with the coldest days likely Tuesday and Wednesday (as noted by the bright purple shading), with gradual "warming" later in the week but still temperatures well below normal.

18z Dec 23rd GEFS forecast of 2 meter temperature anomaly (shaded) valid Dec 27, 2021 - Jan 1, 2022


So how cold are we talking?  Well if your thrown in all of the computer models together (about 100 of them), and take the median forecast, this is what it shows for the forecast low temperature on Wednesday, Dec 29th.

National Blend of Models (NBM) forecast of low temperature Dec 29th, 2021

Wow!  Some locations colder than -10F!  It is worth noting low temperatures can be tricky to forecast when it comes to extreme cold as temperature drops are very dependent on winds becoming light and clearing of the skies.  But this is the median of many model forecasts, so it's possible it could be even colder, or warmer than the numbers shown above.

You may ask when was the last time Spokane dropped all the way down to -10F or colder.  Well it's been awhile, but certainly can happen.  

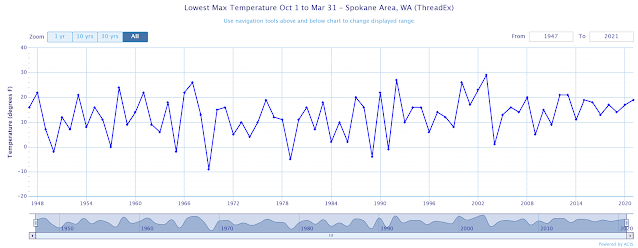
It hasn't happened since the 2010-11 winter, where there were 3 instances of the bitterly cold nights.

And what about high temperature? 

National Blend of Models (NBM) forecast of high temperature Dec 29th, 2021

Many areas possibly not getting out of the single digits according to this model blend forecast!

With areas of moderate to heavy snow through Christmas weekend, and bitterly cold temperatures next week, be sure to keep up to date with the latest forecasts, advisories, and warnings at www.weather.gov/spokane


Tuesday, December 21, 2021

Looks Very Cold Next Week

 You may have already heard that cold weather is a possibility for next week, the last week of 2021.  While some may say "it's supposed to be cold in winter", it is still worth taking a look at some numbers and charts to see what is possible and how it compares historically.  In our area, the coldest day of the year on average is the last week in December.

First, let's start by saying that we're looking more than 7 days into the future.  Computer forecasts that far out do have some skill (i.e. better than a coin flip), but they are by no means a slam dunk.  The Climate Prediction Center issued this outlook on Monday (20 Dec).  They have high confidence of Much Below Normal Temperatures next week for Washington to the Dakotas.  The category of "High Confidence" isn't used a lot for an outlook that far out, so this is worth paying attention to.


The reason for their confidence lies in the fact that the major weather modeling systems generally all agree on this pattern.  Here's the temperature forecasts for 850mb (about 4000' elevation) from these models.  First, the European model valid Thursday afternoon (Dec 30th).  You don't need to be an expert to figure out this chart.


Here's the same figure from the U.S. model, but for two days earlier (Tuesday afternoon 28 Dec).  Looks very similar to the European models, but just earlier in the week.


Lastly, here's the Canadian model forecast for Wednesday 29 Dec.  You can see that this model pushes more of the cold air into Montana and less of it into the Inland Northwest, which is what usually happens.  But even this forecast would still mean cold weather for our area.


How cold could it get?  Forecasting cold temperatures is MUCH more difficult than hot temperatures.  The main reason for this is that cold temperatures rely on a careful combination of several factors (snow on the ground, clear skies, light winds, dry air, etc.).  So a lot could change in the forecast.  But we can run some probabilistic numbers to see where things could go.

If you throw all of the computer models together (there's about 100 of them) and take the median forecast, here's what you get for the forecast high temperature for next Thursday (30 December).


A high of only 9 degrees in Spokane doesn't happen all that often.  When was the last time you may ask?  Believe it or not, it was on November 24th of 2010 (pretty early in the winter for that kind of cold).  Spokane had a low of -10F and a high of only 9F, with 5" of snow on the ground.  

Here's a chart showing the coldest daytime temperature at Spokane Airport each winter since 1947.  While just about every winter has days that don't warm above 20F, staying below 10F during the day isn't all that common.


The map of high temperatures above was the median of all of the models.  Statistically, that means that half of those 100 models actually think it will be colder than that image.  Conversely, the other half of the models think that things will be warmer, with about 10% of the forecasts winding up with a high in the mid 20s.

As we started off this blog entry, there's a long time between now and next week, and the forecast could still change considerably.  There are still some model scenarios that keep much of the cold air to our east, but they are the minority.

One important note about the upcoming potential cold snap.  It does not appear that this point that there will be a lot of wind with the cold.  So wind chill doesn't appear to be as much of a threat.  But again, this could change in the coming days.  


Friday, December 17, 2021

Why was Thursday's snowstorm such an icy mess for commuters?


For anyone driving on the roads in the Spokane/Coeur d'Alene metro area on Thursday (16 Dec 2021), the roads were rather icy in spots.  The Spokesman-Review published a few pictures online.  More than 100 accidents were reported by Spokane Police Department, leading them to urge people to stay home if possible.  


An Ice covered Grand Boulevard created the conditions for this multi-car pileup that also included a STA bus that slide into a power pole in the southbound lanes below 12th Ave, Thursday, Dec. 16, 2021. No one was injured, but southbound Grand was shutdown until tows could be arranged and the road de-iced by the city.

Colin Mulvany The Spokesman-Review


The snowfall amounts from this event weren't particularly noteworthy.  Here's a map of snowfall reports from the CoCoRaHS website.  In the Spokane area, 1 to 3 inches of snow fell.  Over in the Idaho Panhandle, snowfall was much more varied, with a few reports of 5 to 6 inches, but most folks in the Coeur d'Alene area received 3 to 5 inches.  In other words, this was a fairly typical snowfall event for our area.


Additionally, the temperatures were rather cold, and the snow was dry.  The kind of snow that is difficult to make into snowballs.  And that kind of snow usually doesn't cause icy roads.  So what caused yesterday's treacherous icy driving conditions?

To answer that question, we need to look at the road pavement itself.  Or more specifically, the temperature of the pavement.  Thankfully, in recent years the Departments of Transportation (Washington State DOT, Idaho Transportation Department) have installed pavement sensors at various locations.  These sensors measure not only the temperature of the pavement, but they can also sense whether there is moisture on the pavement, and if it's in the form of liquid or ice.

You can see one of these sensors in the pavement on the Highway 395 camera near Loon Lake.


Here's a graph of the temperatures on I-90 at the Perry Curves.  Note that the temperature was around 29F during the night, but then it warmed to 34F shortly after 9am.


According to the weather observation at nearby Felts Field, light snow started to fall just before 10am, and continued until 4pm, with air temperatures of 31F or 32F.  So as that morning snow began to fall on the road pavement, the 34 degree pavement was able to melt some or all of the snow, resulting in wet or slushy pavement on well-traveled roads.  But note that the pavement temperatures began too fall just after noon, which is typical for pavement temperature.  The pavement cooled below freezing around 230pm, and all of the moisture that was on the roads quickly froze, causing the icy conditions that snarled traffic.

Looking at the sensor at I-90 and Liberty Lake, we see a little different situation.  At that location, the road temperature was around 28F at sunrise, but only warmed to 31F during the morning, and then quickly cooled back to 30F during most of the snowfall event.  This cooling occurred right after the snow started.  In other words, the pavement remained below freezing for the entire snowfall event, so it's likely that there was little or no melting of the snow, and conditions at this location probably weren't as icy as other parts of the metro area.


So the icy roads on Thursday took a careful combination of several factors. The air temperatures were cold and stayed below freezing.  The mid-morning timing of the snow allowed some of the roads to warm above freezing, which melted and then refroze later in the afternoon.  Locations either north or south of the Spokane metro area either had the snow start too early to allow pavement melting, or started too late to melt and refreeze.  Had the snow in Spokane started a few hours earlier, the outcome would likely have been much different than what we experienced.


White Christmas for 2021?

It is that time of the year when many residents of the Inland Northwest are asking "Will we have a White Christmas this year?"  In this blog we will dig into the details, and try and answer this important question.

We must first begin with what our climate has to say about the chances.  NCEI recently released an updated map based off 1991-2020 data.  This is the odds of a White Christmas based simply off historic odds.


On average, areas near the Cascades, northern WA, and the Idaho Panhandle have a White Christmas.  Spokane odds are close to 50%, while the odds drop off further as you head south into the Tri-Cities area and Lewiston area.

But what about this year?  For it to officially be declared a White Christmas, the snow depth on the ground needs to be 1" or greater.  So let's begin with what is on the ground now from our dedicated CoCoRaHS observers.

Snow depth reported from CoCoRaHS observers on Dec 17th, 2021

According to the map snow is covering the ground over many areas that already have good chances for a White Christmas.  

So what does the weather look like as head into Christmas Day?  An active weather pattern as a strong blocking upper ridge sets up near the Aleutian Islands and a deep trough over western North America and the northwest US.

12z/Dec 17th GEFS 500mb heights and anomalies (shaded) valid Dec 18-25th, 2021

Multiple weather systems moving through the region will produce precipitation.  Here is what the model shows for total precipitation through December 25th.

12z/Dec 17th GEFS total precipitation (inches) from Dec 17-25th, 2021

Note that one of the wettest area through Christmas Day over the United States is over Washington, North Idaho, Oregon, and California.

But this is just precipitation.  Since the pattern looks wet, the real question about White Christmas chances this year will come down to temperature.  Will precipitation fall as rain, snow, or a mixed bag?  Let's look at the temperature anomalies through the period beginning Saturday.

12z/Dec 17th GEFS forecast of 2 meter temperature anomaly (degrees C) from Dec 18-25th, 2021

Note that as we go into next week, there is a growing area of cold air over Canada, but it looks like much of this arctic air will stay north of our area (at least through Christmas).  For our region there are some warmer temperatures over southern WA into the Lewiston area on Saturday, but these diminish with no strong anomalies next week (close to normal temps for late December).

But an anomaly doesn't tell us much about if precipitation will fall as rain or snow.  For example for some of our colder spots (Methow Valley), warmer than normal temperatures will still lead to snow most of the time in late December.  So let's dig a little deeper.

Here we will show an ensemble system (National Blend of Models) which shows forecast temperatures for several cities through next week.  This method has proven to be more skillful than using just one model forecast.  The red line is temperature. Also note these temperature forecasts are the average from a variety of weather models and ensemble systems, and don't reflect uncertainty in the numbers which tends to increase with time, especially in the day 5 and beyond time frame.  

We will work our way from north to south.  Let's begin with Sandpoint and Omak.

Sandpoint


Omak

With many areas already having snow on the ground, and a high likelihood for more, White Christmas chances are looking good.

Now let's move south, looking at Wenatchee, Moses Lake, and Spokane Valley.

Wenatchee 

For Wenatchee, temperatures near or below freezing and more snow opportunities the odds are looking good for a White Christmas as well.

Moses Lake

Spokane (Felts Fields Forecast)

This is a tougher call for these two locations.  Rapid warmup into Saturday, then temperature hovering around the freezing mark through Christmas.  This suggest a mix of rain and snow may fall through the period.  But with several opportunities for precipitation and temperatures cold enough for snow most of the time, odds are looking favorable for a White Christmas.

Let's go further south and take a look at Pullman and Lewiston.

Pullman


After a period of above freezing temperatures on Saturday, it looks like temperatures will hover near or below freezing through much of next week.  White Christmas chances are looking high.

Now one of the trickier spots, Lewiston.

Lewiston

As you can see, temperatures are forecast to be near or above freezing for much of next week, so there is more uncertainty of a White Christmas.

In summary, odds of a White Christmas are looking higher than historical odds this year.  Most areas should have a White Christmas, with the Lewiston area having the highest uncertainty.


Thursday, November 4, 2021

Winter 2021-22 Outlook

With another La Nina winter in store, many are probably wondering what flavor this version will bring.  Let's begin with the typical La Nina pattern that sets up.


Typical La Nina Pattern

In past La Nina winters, we often go into a northwest flow pattern bringing wetter than normal, and at times cooler than normal conditions.  But the key word in the graphic above Polar Jet Stream is variable.  The jet stream rarely stays in this configuration throughout the entire winter as there are other factors that can alter the jet stream.

What is the current state of La Nina?  Sea Surface Temperatures (SST) have been on the decline in the central and eastern Equatorial Pacific with La Nina conditions already present.

Average SST (Sea Surface Temperature) anomalies Oct 3rd-Oct 30th, 2021

The probabilities of La Nina conditions remain high through the winter as noted by the blue (La Nina) probabilities for each 3 month season (DJF is December-January-February).

As you'll see with some charts that follow, snowfall varies for La Nina winters.  But if we average all the La Nina Winters together between 1950-2015, snowfall is typically above normal across the region as the map below shows.

% of normal snowfall for La Nina winters between 1950-2015 when compared to all other winters

The map above is interactive and can be found here.  Each site is clickable and will bring up a comparison chart for El Nino, La Nina, and Neutral years.

As some of you may know we are heading into the second of consecutive La Nina winters.  So what did the second La Nina winter bring in terms of snow for Spokane for previous cases?  As you'll see, 9 out of 10 brought normal or above normal snow.

Observed Spokane snowfall for the 2nd of consecutive La Nina winters

What is the Climate Prediction Center outlooks showing?  They favor elevated odds of cooler and wetter than normal conditions.

The Climate Prediction Center Seasonal Temperature Outlook valid Dec 2021-Feb 2022.  Issued October 21st, 2021.


The Climate Prediction Center Seasonal Precipitation Outlook valid Dec 2021-Feb 2022.  Issued October 21st, 2021.

How about the climate model projections?  The NMME (North American Multi-Model Ensemble) is favoring normal temperatures and above normal precipitation for the region.

NMME (North American Multi-Model Ensemble) forecast of temperature and precipitation December 2021-February 2022.

So at this point odds are tilted towards the cooler and wetter than normal conditions.  

This outlook is good news for the ongoing drought across the region.  While there have already been some improvements with the drought situation, we need more precipitation. Here is the U.S. Drought Monitor as of November 2nd showing severe to exceptional drought still over most of the region.  

US Drought Monitor as of November 2nd, 2021

The wetter than normal winter that is favored should bring continued improvements with the latest outlook showing this.

US Seasonal Drought Outlook valid Oct 21st, 2021-Janueary 31st, 2022.  

One important thing to keep in mind is we are talking about winter conditions averaged over a three month season.  There are several shorter term weather events that can create a multitude of weather hazards.  This includes freezing rain, blowing snow, local flooding, windstorms, and heavy snow events.  Periods of quiet weather typically occur as well.  Are you ready for winter?  Now is the time to get ready.

Friday, October 29, 2021

Does it seem like it's getting windier in the Inland NW?


One comment we've heard a fair amount is how windy it's been.  And people aren't just talking about the windstorms of Jan 13th and Mar 28th.  It just seems like there's wind every day.  "Oh great, just what we need.  More wind."  So has it really been windier than normal?  Does the data back up our perceptions?  If so, what is the reason for it?  And is this a trend we can expect to continue?  OK, lots of questions, so let's see if we can provide some answers.

First, we have to start with a caveat, namely, that archives of wind data don't go back nearly as far as temperature records.  Thermometers are fairly inexpensive and have been in widespread use for a long time.  As such, temperature records in the Inland Northwest go back into the early 20th century, and at some locations (like Spokane or Lewiston), go all the way back to 1881.  Unfortunately, wind anemometers (those spinning cups used to measure wind speed) are much newer to the scene of weather measurements, and generally they've only been found at airports.  So wind records are much less plentiful both in location and time.  Even so, we'll use what we have and try to draw some conclusions.

Has it been windier than normal this year?


To hopefully answer this question, we gathered all of the wind data we could find at a few different locations in the region.  As with most data studies, there's a couple of ways to slice and dice the data.  With wind, it really comes down to two types of measurements: the average wind over the entire day, and the peak wind gust of the day.  They're obviously related to each other, but not the same.  A thunderstorm can create a 50 mph gust on an otherwise calm day.  Or a steady 25 mph wind can blow all day without ever gusting much over 30 mph.  Which day is windier?  So we'll try to look at both measurements to glean our answers.

First we'll start at Spokane, mainly because it has the longest data record.  Peak wind gust observations for Spokane go back to 1969, while daily average wind speeds started in 1984.  

We'll start by looking at the number of days each year where the wind gusted to 50 mph or more.  


Looks like just about every year has 1 to 3 events with wind gusts over 50 mph.  And 2020-21 was no different, with a total of 3 events.  Notice, though, that there have been years with a few more windy days in Spokane.  2011-12 had 5 such days.  And looking back much further, the winter/spring of 1970-71 had 6 days with 50 mph or more, and 1971-72 had a rather amazing 12 such days.  

So let's bring it down a notch, and look at days with gusts of 40 mph or higher.  (The orange line is average of the previous 5 years)


Now we start to see a slightly different pattern.  1971-72 still tops the list, but there are now several other years that had a lot of windy days (greater than 40 mph gust).  1988-89 as well as 1989-90 were rather windy years in Spokane.  But then there seems to be a lull in the wind for Spokane for the 1990s and early 2000s.  Since 2005 however, the windy days have returned.  More recently, the >40mph days in 2020-21 totaled more than any year since 2013-2014.  So from that standpoint, yes, 2020-21 was winder than recent years.  But it certainly wasn't the windiest ever.

When we lower it down to 35 mph, things become a little more interesting.


Now, the really windy years of the early 1970s don't show up as well.  In fact, the top winters are now the 1988-89, 2013-14, and our current 2020-21.  So while some years may have a few really windy days (like 1971-72), they may not have many other windy days during the year.  Meanwhile, other years may have a number of days over 35 or 40 mph, but few if any over 50 mph.

Peak gusts don't always give a good indication of a windy day.  A thunderstorm or shower can cause a strong wind that lasts only an hour in an otherwise calm day.  Average wind looks at all hours of the day and averages them.  Below is the number of days in Spokane where the average wind speed was greater than 15 mph.


Similar to our results from looking at peak gusts, the 2020-21 as well as the 2019-20 years have been windier than any year since 2011-12.  So yes, it has been windier in Spokane of late than for the past 10 years.  Still, we see even windier years in the late 1980s as well as 1998-99.  So it would be wrong to say that this past year is the windiest ever in Spokane, or even that there is a trend for windier years.

Let's expand our study a bit, and look at other locations in the Inland Northwest.  The >40mph wind gust data from Pullman is interesting.


The number of days with gusts >40 mph at Pullman this past year (2020-21) was higher than all other years, with the exception of 2010-11.   So for the folks in Pullman/Moscow, it was a noteworthy year for wind.  Or was it?  Here's the number of days with wind gusts >45 mph.


Now the past year doesn't look so windy compared with earlier years.  What gives?  This would suggest that yes, Pullman/Moscow had a large number of windy days (over 40 mph), but didn't necessarily have an unusual amount of very windy days (over 45 mph).  

Further to the south in Lewiston, we see a similar signal as at Pullman.  Here's the number of days with gusts >40 mph at Lewiston:


Again, like Pullman, 2020-21 shows up as one of the windiest years when viewed with this metric.  And here's the number of days with peak gusts >45 mph:


Still, this past winter was one of the windiest, but not the windiest year on record.

At Moses Lake, the story is a bit different.  Here's the number of days each year with gusts >40 mph.


2019-20 is actually the clear winner for this category, with 2020-21 similar to several other years.

For average wind speed at Moses Lake, the past few years aren't really anything exceptional, especially when compared with the 1998/99 winter (a very wind La Nina winter) and the 2001/02 winter.


So in summary, in some respects, yes, it has been windier in the Inland NW recently than over the past 10 years.  But it would be wrong to say that "it's never been this windy".  Clearly the data shows that there have been windier years in the past.

Saturday, October 16, 2021

Firestorm 1991

 This Day in History!

Today marks the 30th anniversary of the event knowns as "Firestorm" in the Spokane Area. This event was characterized by a dry spell that occurred from late August through early October. The fall rains were late to arrive with fuels crispy dry and able to carry fire very easily. The event itself was driven by a strong cold front that produced extreme southwest winds with numerous ignitions from downed powerlines. Multiple fires broke out that quickly overwhelmed initial attack as strong winds fanned flames all across the Spokane Area. In this blog, we will re-visit Firestorm: news articles chronicling the event, the antecedent conditions, and of course the meteorology.

"Northern Spokane County like war zone"

Here is a portion of an article courtesy of the Spokesman Review detailing the conditions that day.

Article courtesy of Spokesman Review

Below are a couple maps summarizing the fires across Northeast Washington and North Idaho, followed by a zoomed in look at the Spokane area.


A summary of various newspaper articles from that day showed
  • 114 homes destroyed
  • 2 fatalities
  • 50,000 acres burned
  • 80 fires
Lets shift gears and talk about conditions leading up to the event, beginning with total precipitation leading up to the summer of 1991.  Below is a chart of precipitation accumulations at the Spokane International Airport for the water year. Each water year begins on the first of October. The month of October is when we will see mid-latitude storm systems move across the United States and is a good starting point for determining precipitation accumulations over an annual cycle.

The brown curve represents the average precipitation accumulation for the water year in Spokane and the green curve is the actual precipitation accumulation that fell from October 1st, 1990 through the day of Firestorm. Taking a quick glance, it's evident that precipitation accumulations followed the normal curve very closely; however, taking a closer look, it's also evident that a dry spell set up from August into the first half of October. Zooming into this period of the precipitation climate record (black rectangle above) and we see this:


July and August are typically our driest months of the year. The average, or normal, precipitation curve shows this with less than an inch of precipitation usually for this summer period. Then this curve starts to take more of an upward turn around mid September into October as weather systems off of the Pacific Ocean begin to usher in precipitation and shift out of fire season. It's clear to see zooming into this period that this precipitation was delayed. At the time, August through October of 1991 was the driest on record with only 0.18" recorded at Spokane International Airport -- 1.66" below normal!

How about the winds on the event? The next series of graphics are surface analysis charts showing mean sea level pressure (MSLP) through the event starting from the early morning hours on October 16th, 1991 into the afternoon. Keep in mind that the winds peaked during the late morning hours.

At 2:00 AM PDT


At 5:00 AM PDT


At 8:00 AM PDT


At 11:00 AM PDT


At 2:00 PM PDT


The storm intensified through the day, dropping from 994mb (29.35") at 2 am PDT to 984mb (29.06") at 2 PM PDT.  The storm produced the strongest winds in the late morning when the low was in close proximity to Eastern Washington and North Idaho.  Here are the observations from Spokane International Airport during the event.

Spokane International Airport observations for October 16th, 1991 from 7 AM to 7 PM PDT

Note the wind/wind gust columns with a peak gust of 62 MPH.  Also note the visibility and remarks where smoke and dust reduced visibility to as low as a quarter mile!

Where were you 30 years ago today?  If you lived in Eastern Washington and north Idaho at the time, you probably still have memories of that day.  Of course there have been many more Firestorms since 1991 (Carlton Complex, Okanogan Complex, Cold Springs/Pearl Hill, etc), but today we focus on what happened on October 16th, 1991.