Some may say, “Yes! This has been a long and harsh winter.” Others may have the opinion, “No. This winter seems pretty typical to me.” Let’s take a look at some data.
- Total snow accumulation
- How long snow has been on the ground
- Average temperature
- Extremely cold temperatures
- Winter’s duration
Our first data set
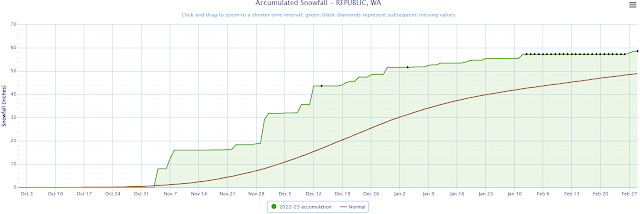
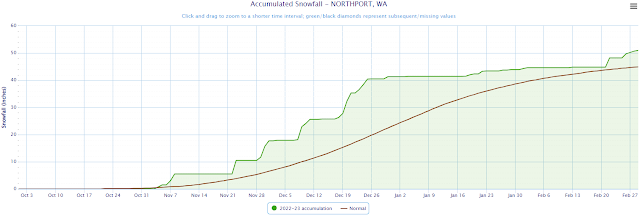
Total snow accumulation: Has this winter been snowier than normal? Let’s look at a handful of snowfall graphs and compare them to the 30 year average (1991 - 2020).Accumulated Snowfall Graphs: 1) Spokane 2) Bonners Ferry 3) Lewiston 4) Wenatchee These graphs compare the snow that has fallen this winter (green trace) with the 30 year average (smooth brown curve).
 Bonners Ferry ID
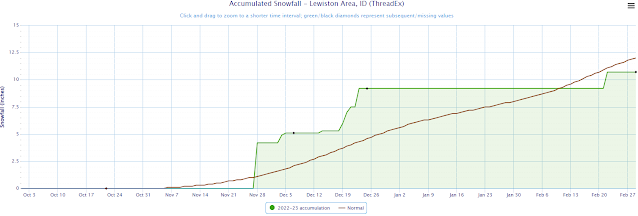
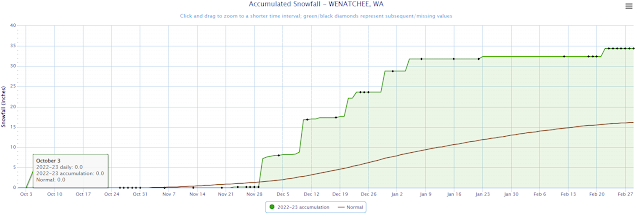
There are similarities between the first three graphs from Spokane, Bonners Ferry, and Lewiston. By February 28th, each trace is within a few inches of the seasonal average. The trace from Wenatchee is much different with nearly double the average snowfall through Feb 28th.
What about snow in the mountains? Snow sensors called SNOTEL (SNOpack TELemetry) collect data from remote high elevation locations across the Western U.S. and Canada. So this map will tell you more about mountain snow than the snow that has fallen in cities and valleys. The graphic below shows the Snow Water Equivalent (SWE) values for river basins across the Pacific Northwest as of March 1st. While many basins in Washington and north Idaho range from 85 to 100 percent of average, north central Washington stands out. Values in the mountains around Omak and Republic are as high as 130 percent of average.
Basin Snow Water Equivalent compared to normal.

Our second data set
How long has snow been on the ground? Have you ever heard someone say something like this, “I remember that terrible winter! We had snow on the ground from Thanksgiving to the beginning of March!”Finding data for how long snow has been on the ground is tough. There are only a handful of sites in the Inland Northwest that take daily snow depth measurements, and periods of missing data over the years makes it difficult to build a climatology of snow depth data. But, here’s a crude table from a few of our dedicated cooperative observers that provide the NWS with daily snow depth measurements.
Consecutive Days with Snow Depth of at Least 1 Inch
With 93 consecutive days of at least 1 inch of snow on the ground, employees of the National Weather Service have seen a lot of white on the landscape this season. Folks around Bonners Ferry are used to seeing snow on the ground for weeks during the winter, but 70 days is a long time to deal with snow on the ground, too.
Verdict based on how long snow has been on the ground: Inconsistencies in the data make this a tough argument. There is also a lot of variability in the typical snowpack across the Inland Northwest depending on elevation and local snow climatology. However, many places in the Inland Northwest received snow in November. For those of us who held onto that snow well into February, you are probably justified in saying that you have seen snow on the ground for a long time this winter
Our third data set
Temperatures compared to average: For the Pacific Northwest winter-like temperatures arrived early. November was a particularly cold month. For the state of Washington, November ranked as the 6th coldest on record according to the National Centers for Environmental Prediction. Idaho experienced its 4th coldest November on record!
December remained cold especially in Washington, ranking 17th coldest on record. The state average temperature for Idaho didn’t rank as cold. Idaho had its 48th coldest December on record.

January trended toward milder temperatures. States in the Pacific Northwest were actually “Near Average” or slightly “Above Average”.

As of the creation of this blog, statewide average temperature ranks have not been calculated for February. However, data collected by the Western Region Climate Center indicate that February will end up with below average temperatures.

Our fourth data set
Extremely Cold Temperatures: Speaking of Arctic blasts, how many of them did the Inland Northwest experience this winter? There have been five identifiable Arctic fronts this winter. Beginning with our first Arctic front in early November and including our late February blast of cold temperatures, the Inland Northwest has experienced biting north winds and dramatic temperature drops about every 3 or 4 weeks this winter.
Our most noteworthy Arctic front of the season occurred between December 21st and 23rd. Widespread below zero readings were observed with some of the coldest locations dropping below -20F, including Porthill (-30F), Addy (-28F), Naples ID (-27F), Colville (-24F) and Bonners Ferry (-20F). Some of these readings were the coldest in decades. Northeast and north central Washington experienced lows of -20 to -30 degrees! Temperatures in our region hadn’t been that cold in a decade or two.

Morning temperatures December 22, 2022
Our most recent Arctic front broke or tied several records for February 23rd and 24th. Spokane’s low temperature of 3 degrees on the 24th tied the record set in 2011. Several stations including Spokane, Wenatchee, Ephrata, and Omak experienced record cold afternoon high temperatures on the afternoon of February 23rd when highs struggled to reach the mid teens and low 20s.

Verdict based on extreme temperatures: While there have been relatively few record cold temperatures this winter, residents of the Inland Northwest are justified in claiming that this winter has featured some of the coldest temperatures in many years. The December 21st to 23rd event was really cold for our region!
Our fifth data set
Winter’s Duration: We have already mentioned that winter “arrived early”. November was much colder than average, and many places across the Inland Northwest were snowier than average in November, too. Will winter also be late to loosen its grip on the region?The latest outlook from the Climate Prediction Center for the month of March does not look favorable for an early arrival of spring. There is a 60 to 70 percent chance of colder than average temperatures for the month of March. Snow in March typically struggles to accumulate and frequently doesn’t last long. However, we may not be done with the threat of lowland snow. The combination of colder than average temperatures and the outlook leaning toward at or slightly above average precipitation suggests that we may still have some white stuff to look forward to.

Final Thoughts: Of course, our views on whether or not this has been a harsh winter will vary from person to person. There is also a lot of variability from place to place. The Inland Northwest climate is highly varied from the Methow Valley to Moses Lake to north Idaho. Where we grew up and our collective experience with winter weather also forms our opinions. And some people just like winter while others do not. We hope you enjoyed reflecting on the winter our region has experienced so far.