Like it or not, weather changes are in the forecast.
Colder than normal temperatures are predicted for next week. The 6-10 Day Outlook issued by the Climate Prediction Center on 16 February calls for a 70-80% chance of below average temperatures for eastern Washington and northern Idaho.
 |
| Climate Prediction Center: 6-10 Day Outlook issued 16 Feb 2022 https://www.cpc.ncep.noaa.gov/ |
Compare the 6 to 10 Day Outlook (above) to the temperature anomaly map over the last 30 days (below). It looks like the atmosphere will undergo quite a flip-flop. Since mid January, much of the Western U.S. and High Plains experienced above average temperatures.
 |
| Climate Mapper: https://climatetoolbox.org/tool/Climate-Mapper |
 |
| Climate Mapper: https://climatetoolbox.org/tool/Climate-Mapper |
 |
| 500mb Geopotential Height Composite Mean for 30 days (Jan 15 - Feb 14) NOAA Physical Sciences Laboratory https://psl.noaa.gov/data/composites/day/ |
This kind of pattern (ridge over the West and trough in the East) looks pretty close to the Typical La Nina pattern. Check out the illustration below. However if you look closely, the ridge axis on the 30 day map above is further east (closer to the coast) than the typical La Nina pattern.
 |
| Typical La Nina Winter Pattern: Source NOAA |
The map below probably demonstrates the orientation and amplitude of the 500 millibar ridge axis more clearly. This anomaly map depicts the 500 millibar difference from average for the last 30 days. The reds and oranges illustrate the strength of the upper level ridge along the coast of Washington and southern British Columbia. Unusually high height anomalies along the coast of Washington and southern British Columbia imply that the Polar Jet Stream further north than we typically experience during the winter months. Subsequently, our typical "wetter" than average La Nina pattern has been interrupted since mid January.
 |
| 500mb Geopotential Height Composite Anomaly for 30 days (Jan 15 - Feb 14) NOAA Physical Sciences Laboratory https://psl.noaa.gov/data/composites/day/ |
Changes are on the way! Over the weekend of 19-20 February, there is strong model agreement of a major pattern shift. By Monday (Feb 21st), the West Coast ridge of the last 30 days will be replaced by a cold upper level trough. The blue colors represented on this 500 millibar forecast from the Global Ensemble Forecast System (GEFS) represent anomalously low heights across the Western U.S. The north to south orientation of the black lines from the Northwest Territories into northern California indicate strong northerly flow aloft.
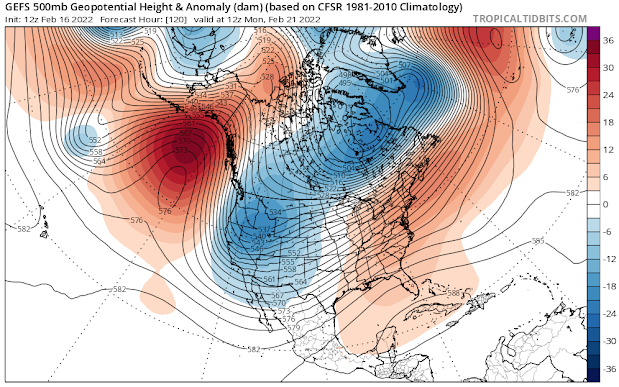 |
| https://www.tropicaltidbits.com/ |
 |
| https://www.tropicaltidbits.com/ |
 |
| https://www.tropicaltidbits.com/ |
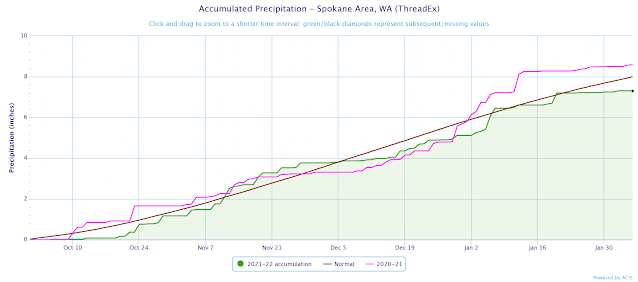
Cold air intrusions and periods of dry weather can be common during La Nina in the Pacific Northwest. The strength and position of high pressure over the eastern Pacific can vary through the winter. So far this winter, the Inland Northwest has experience periods of heavy precipitation in November and December, record snows in central Washington in January (nearly 2 feet in Wenatchee on January 6th), and unusually dry weather from mid January to mid February.
It's unclear at this time how long the below normal temperatures will last. The coldest days are forecast to be between Feb 21-23rd, but below normal temperatures could last through the end of February.