Setting the Stage
Surprisingly, the winter of 1995-1996 prior to the event was not terribly eventful. Mountain snowpack in the region was only on the order of 50% - 90% of average for that time of winter (See NRCS snowpack graphic below from 2/1/1996). There was a decent amount of snow in the valleys and mid elevations, and that ended up contributing a large volume of run off in short amount of time.
The first half of the winter had been rather mild. Mount Spokane Ski Resort didn't open until early January. But the pattern changed in late January and the region quickly saw the snow pile up. The graph below shows the snowfall accumulation for the winter at Moscow, ID. As you can see, by January 18 the town of Moscow had only had 6" of snow for the entire winter. Over the next 10 days, 42" of snow would fall over that location.

Then came a brutal arctic air mass. Temperatures plummeted into the sub-zero range with record-setting nighttime temperatures colder than -20F. This arctic air mass was replaced with an atmospheric river (a.k.a. Pineapple Express) that took aim at the region bringing warm temperatures, winds and copious amounts of rain over several days. Within a matter of a few days, the area went from a deep freeze to near-record high temperatures for February.

This trifecta of weather conditions created one of our biggest rain-on-snow flood events. This trifecta is the 1) warm temperatures. 2) winds and 3) significant rains. Underneath the snow the ground was for the most part frozen, meaning that almost all the rain and snow melt contributed to the run off as opposed to at least some percolating into the ground. And add to that the somewhat unpredictable nature of ice jams that had formed on creeks and rivers in the preceding cold snap and it was a perfect recipe for major flooding.
The table below shows the dramatic change. On the morning of February 2nd, the temperature was -26F at Moscow with 19" of snow on the ground. Six days later, temperatures were in the 50s and all of the snow had melted. In addition, 3.54" of rain fell between the 5th and 9th.

Up in the mountains, the scenario was even worse. Here's the weather observations from Wallace, ID. The 22" snow pack on the 1st of the month had completely melted away by the 9th as 5.55" of rain fell over the period of a week.

How the Rivers Responded
Many creeks and rivers across the Pacific Northwest saw major and near-record flooding. Debris flows and landslides exacerbated the problems throughout the region. In our area, the hardest hit spots were in Eastern Washington and the Central/Southern Idaho Panhandle.Down along the Clearwater River, Highway 12 lost a 75 foot long bridge section between Lewiston and Orofino. Homes were lost in the Big Canyon Creek drainage near Peck. The video below from KHQ has some dramatic footage of the Highway 12 washout and a home being actually floating down Big Canyon Creek.
St. Maries, ID had four levees breach, partly due to the damage from river ice. This led to the inundation of over 100 homes and several businesses. The picture below show the town of St Maries on the right. The river coming in from the upper left is the St. Maries River and in the lower portion of the picture, the muddy brown areas are the parts of the community that were protected by the levees from the St Joe River before they breached. If you look closely, you can see several roof tops poking through the murky flood waters.
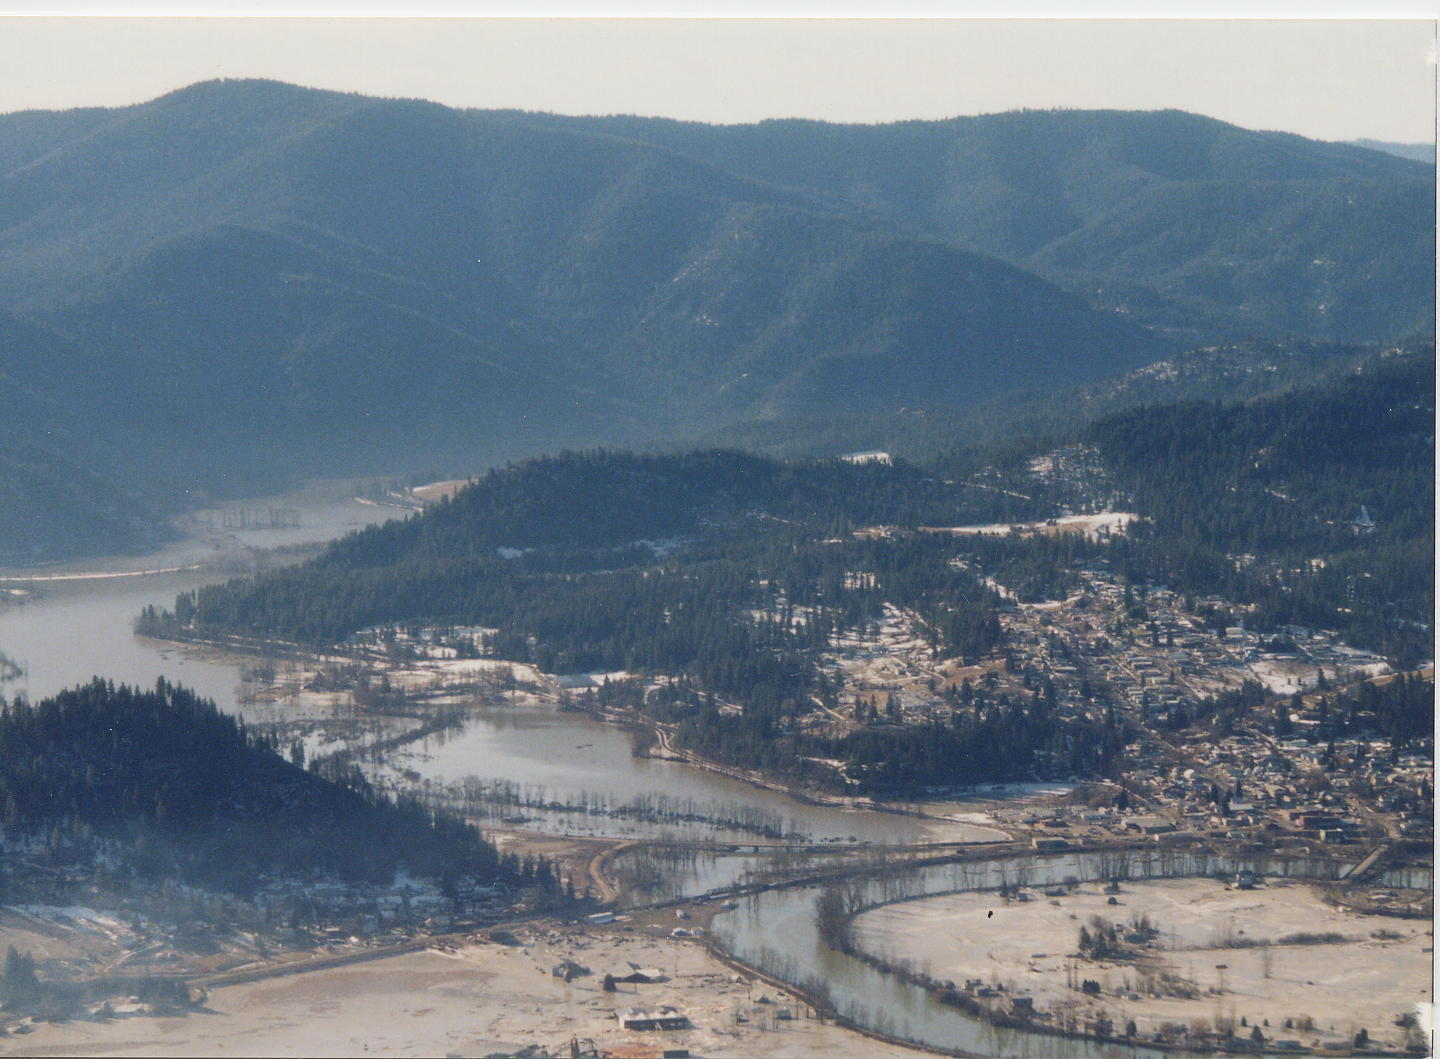 |
| Confluence of St Maries & St Joe Rivers at St Maries, ID |
The North Fork of the Palouse River filled the concrete river channel in Colfax WA, but did not flood the town, giving the 1960's era flood mitigation project its biggest test to date. Just upstream of the project hundreds of community members frantically worked to reinforce the levee protecting the neighborhoods on the north end of town to keep it from breaching.
 |
| Palouse River at Colfax, WA |
Here is a sampling of some of the other impacts during the event.
- Several communities were cut off when roads and highways were damaged, forcing evacuations where possible
- Several residents in the Coeur d'Alene River basin were cut off and had to be airlifted to safety and other rescues were undertaken in boats and ATVs
- Numerous roads were closed and/or damaged due to flooding or landslides including Highways 95, 3, and 12 in ID, and Highway 129 in SE Washington.
- The dam on Winchester Lake was over-topped and there was a fear the dam would fail and send a flood wave down Lapwai Creek. The dam held, but Lapwai Creek still over-topped the levee in Culdesac ID and forced an evacuation of part of the town
- The community of Cataldo ID worked to build a sandbag levee to prevent the river flowing back under the 1-90 overpass but eventually the river got too high, broke through the emergency levee and inundated Cataldo ID with several feet of water.
- The Palouse River at Potlatch ID gage set a record and caused extensive flooding in the town of Palouse WA
- Paradise Creek in Moscow ID flooded campus housing and forced closure of the University
- The National Guard was mobilized in both WA & ID to assist during the floods
- Cedars Floating Restaurant on Lake Coeur d'Alene ID was kept from floating away thanks to the efforts of tugboats.
- The flooding caused at least $30,000,000 of damage (in 1996 dollars) to infrastructure and homes in Eastern WA and Northern ID
1996 Flood in historical context
You might be wondering how often we see floods of this size in our area. It is certainly one of the largest floods on record for many of our waterways. However, only a handful of stream gages that were affected in this flood have records that go back farther than 40 years or so. As big as this flood event was, even setting records at some gages, the USGS estimated that the only stream gage that reached its 1% chance annual flood (a.k.a. the "100 year flood") was the the Palouse River at Potlatch. The table below is a quick and dirty analysis of where the 1996 flood peak ranks in a selection of stream gage records.
Stream Gauges
|
1996 Flood Peak
|
Rank in Record1
|
Years of Records1
|
St Joe River at St Maries
|
42.00 ft
|
2nd
|
1993-2016
|
Coeur d’Alene River at Prichard
|
10.24 ft / 17,000 cfs
|
2nd
|
1951-2016
|
Coeur d’Alene River at Cataldo
|
51.62 ft / 70,000 cfs
|
2nd
|
1911-2016
|
Paradise Creek at Moscow
|
11.26 ft / 970 cfs
|
1st
|
1979-2016
|
Palouse River at Potlatch
|
22.15 ft / 14,000 cfs
|
1st
|
1967-2016
|
Lapwai Creek at Lapwai
|
9.70 ft / 5,010 cfs
|
2nd
|
1975-2016
|
Asotin Creek at Asotin
|
6.50 ft / 3,030 cfs
|
2nd
|
1990-2016
|
Spokane River at Spokane
|
28.04 ft / 36,500 cfs
|
13th
|
1891-2016
|
Palouse River at Hooper
|
17.95 ft / 28,000 cfs
|
2nd
|
1948-2016
|
| 1Records may contain some gaps |
About the Weather
Weather conditions prior to the cold and snow of late January 1996 were unremarkable. January 1996 started out slow as far as winter conditions were concerned, but the second half of the month saw quite a bit of snow and then cold. On average, nearly a foot of snow fell across the lower elevations during the last two weeks of the month. Then bitter cold air settled into the valleys which dropped maximum temperatures into the single digits.
So the scene was set to cause problems if the right weather came along:
The Atmospheric River is a cold season phenomenon that typically occurs between October and March for the Pacific Northwest. A strong jet stream extends well into the lower latitudes of the northern Pacific Ocean, transporting enormous amounts of moisture into the mid-latitudes. The sample loop below from February 2015 is similar to what happened during the flood event of February 1996. Not all Atmospheric Rivers and their effects on the Pacific Northwest are the same, but all tend to bring in much warmer and wetter weather. If enough cold air is in place then potentially heavy snow followed by rain could be expected in the winter months.
So the scene was set to cause problems if the right weather came along:
- Fresh and deep lowland snow pack even as far south as the Lewiston/Clarkston area.
- Bitter cold valley temperatures to aid in freezing rivers and streams.
- Frozen ground
Atmospheric River of Feb 4th-8th, 1996

Color Enhanced Water Vapor Satellite - Feb 05-09, 2015
The colorized water vapor image above shows an active Pacific Jet Stream picking up moisture from
the Tropics and moving it swiftly east and north. This is similar to water waves crashing on the beach, except in this case, the atmosphere is the "water".
the Tropics and moving it swiftly east and north. This is similar to water waves crashing on the beach, except in this case, the atmosphere is the "water".
The upper level weather pattern for the February 1996 Atmospheric River (a.k.a. Pineapple Express) event had a high pressure ridge over the western U.S. and a strengthening Arctic low pressure system over southwest Alaska. This created a strong southwesterly jet stream which stretched past the dateline (180 degrees longitude) in the Pacific Ocean and as far south as Hawaii, which is where the term "Pineapple Express" comes from.

High pressure over the western U.S. was giving way to increased storm activity from the deep low pressure system over Alaska. This low pressure storm system was responsible for maintaining the moist jet stream and sending turbulent and wet waves into the Pacific Northwest.
Here's a loop of how the weather pattern evolved Feb 5-8, 1996. There are several waves or kinks in the flow that moved into the Pacific Northwest. What's important to note is the overall jet stream position remained stationary for several days allowing for a continuous barrage of moisture and warm air into the region.
Upper level atmospheric wave chart Loop Feb 4-9, 1996
Warm temperatures and wind were the other factors in this event. As mentioned before, it was very cold before the event, which allowed rivers to freeze on the surface and recent snow to stay put. The cold temperatures also froze the ground, which would cause the coming rains to run-off into rivers rather than soak into the soil.

Red circled area approximately where worst flooding noted.
Cold temperatures on Feb 2, 1996 in purple and blue above show below zero readings locked into the Central Basin of Washington and Oregon extending east into the flooded areas.
By Feb 5, 1996, the cold air (note warmer yellow areas below) in southeast Washington and the Idaho Panhandle was 'washing' away with surface temperature readings in the 40s and 50s which certainly aided in rapid snow melt. These warm temperatures would continue into February 8th.
 Red circled area approximately where worst flooding noted.
Warm air was also coincident with increased southwest winds which moved over the region overnight on Feb 6th. These winds persisted through the rain event. Winds of 15 to 25 mph over the Washington and Idaho Palouse extended northward into the Spokane and Coeur d'Alene area as time went on. The wind rapidly melted snow even during the nighttime hours as temperatures remained well above freezing.
By Feb 9th, a cold front was finally able to move into the region and shut off the rain and temperatures began to come down to more seasonal levels.
All the weather factors came together to force this historic, rain on snow flood event:
- Very cold air and snow before the event.
- 4 days of persistent, moderate to heavy precipitation.
- Unusually warm temperatures.
- Periods of southwest winds 15 to 25 mph.
Other contributing factors included:
- Frozen ground
- Ice jams on frozen streams and creeks
Fun Fact
The Spokane Weather Forecast Office was transitioning operations in the months prior to this event. The administrative & operational staff moved from the Spokane Airport into our new building between July and September of 1995, and the new crew of forecasters arrived in November and December of that year, just 2 months before the near-record flood event. The weather radar was installed in December 1995 and was still going through it's calibration during the flood.And here's a requisite picture of the Spokane Falls from February 1996, the 13th most spectacular display there since 1891, according to the USGS river gauge.


