Monday, July 28, 2014

July 23 2014 Severe Thunderstorm Review

On July 23rd, very strong thunderstorms moved across the Inland Northwest.  These storms produced weather that is uncommon in our part of the world.  But possibly not as uncommon as you might think.

Two years earlier, 20 July 2012, a very similar weather event occurred in the Inland Northwest.  Folks in Ferry county will remember it for the massive blow-down of trees and power lines that crippled much of that county for weeks.  And people north of Lewiston will remember the baseball-sized hail that fell from a thunderstorm.  But for the major population centers (Spokane/Coeur d'Alene, Lewiston, Wenatchee), this event wasn't very impressive.

But the recent July 23rd event brought a direct hit to parts of the Spokane metro area as well as locations to the north.  As such, it has received a great deal more attention.  

Before we get to the thunderstorm that hit the metro area, there were some other big storms that were also impressive.  The first developed in southeast Washington near Pomeroy.  It moved to the northeast, dropping hail the size of golf balls.  Here's the radar image of it as it was crossing the Snake River.

Radar image of a severe thunderstorm at 3pm 23 Jul 2014.  The yellow box is the NWS Severe thunderstorm warning area
By the time the storm reached Pullman, the hail was still ping pong ball sized.  Meanwhile, another thunderstorm was developing to the south that also prompted a warning.  You can see both storms in the image below.  The first storm is just north of Pullman, while the second storm is to the south of it.

Radar image of two severe thunderstorms at 335pm.

This storm weakened a bit before reaching the Pullman/Moscow area.  Hail was a bit smaller, the size of half-dollars.

As this was going on, another strong thunderstorm developed near Kettle Falls.  It wound up producing the largest hail of the day.  Two inch hail stones left dents in cars and cracked windshields along Highway 395 just south of Kettle Falls.

Radar image of severe thunderstorm near Kettle Falls at 327pm.

These storms were all similar: high reflectivity cores indicating large hail and heavy rain, along with some strong winds.  Below is the radar showing a different storm about to hit Spokane.

Radar image at 4pm of the storm that hit Spokane (left side of the image). 

 Doesn't look all that impressive, does it?  The storm over Benewah county (right side of the image) is the storm that previously went through Pullman, and is still putting down large hail.  The storm on the left that's about to hit Spokane pales in comparison.  Or does it?  Here's the radar velocity image at the same time.

Radar Velocity image at 4pm
Do you see that area of bright green colors?  That is showing very strong winds (about 60 mph) heading for the west plains of Spokane.  The NWS office measured a gust of 61 mph while the airport recorded a 67 mph gust. 

Here's a video of the wind and rain at the NWS office.


As the gust front went by the radar, the color switches from green (which indicates winds blowing toward the radar) to red (winds blowing away from the radar). 

Radar Velocity image at 420pm


The light orange color in the center of the image indicates winds of 70 mph.  On Five Mile Prairie, a wind sensor measured a gust to 65 mph.  The storm continued to track to the northeast.

Radar Velocity image at 434pm
By this time, the strong winds had reached the Deer Park and Chattaroy area.  As you can see from these three images, the strongest winds followed a line from the West Plains, across northwest Spokane and Nine Mile Falls, and up to Deer Park.  

Strong winds also hit the Idaho Panhandle, from Silverwood up to the Lake Pend Oreille area.  The number of injuries sustained from falling trees was far more than we typically see in an Inland Northwest thunderstorm event.  A map of the hail and wind reports is shown below.   Or you can go to this site for a detailed look at the reports.  

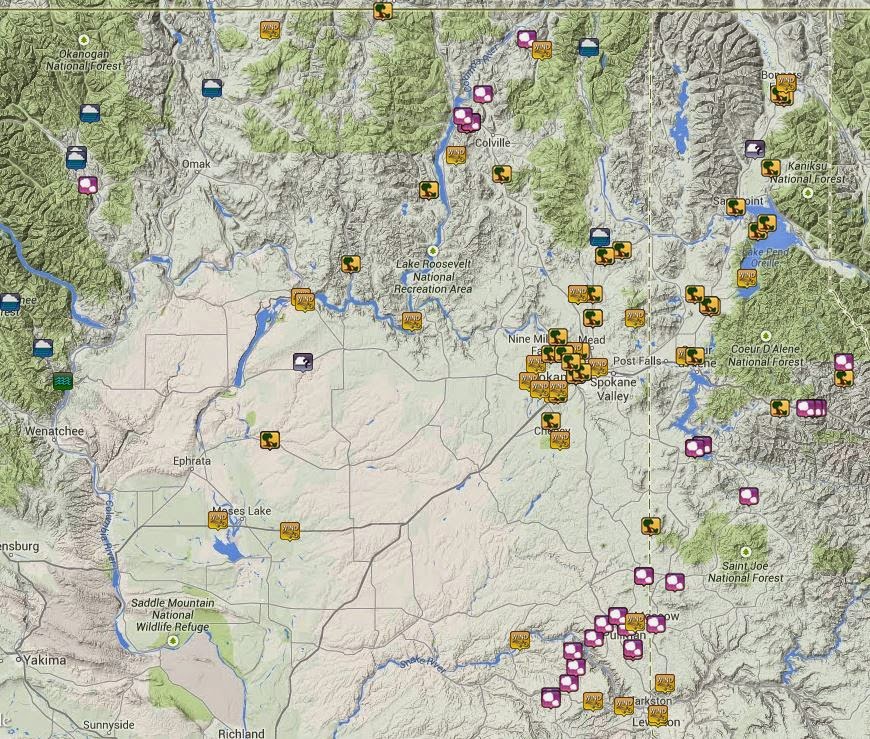
Severe Weather Reports for 23 July 2014


Wednesday, July 16, 2014

Does a hot July mean that August will be hot?

So far, it has been a blistering July. We've seen day after day of scorching temperatures above 90°F with may locations topping 100°F. Today is the 9th day in a row that Wenatchee has seen temperatures at or above 100°F.  This sets the record for the longest consecutive streak of 100°F or higher in Wenatchee ever!  Records for Wenatchee Airport only go back to 1959, but this is still a an impressive mark.  Spokane’s streak of 90+°F days is now at 11 days and is expected to top off at 12 on Thursday before cooling down, making it the 4th longest streak in Spokane’s history. This heat has led to everyone asking one question, “What is August going to be like and will it be as hot as July?”


Well the simple answer is… we’re not sure yet. Is a hot July always followed by a hot August? Our past records have had some scorcher July's like this one and then very cool August's. For example, 1985 in Spokane saw a July much like our current one, at 5.1°F above average, only to be followed by an August that was 3.8°F below average. On the flip side of that, Wenatchee had a hot July in 2004, 3.9°F above average, only to be followed by an even warmer August that was 4.2°F above average. So there's no guarantee for August. However, based on history and our data we can make some predictions at what will happen. 


This graph shows the percentages of occurrence of a hot August, a cool August, and a normal August following a hot July. If you live in Spokane (green pyramid) and it's been a hot July, there is a 44% chance of a hot August.  But that means that there's a 56% chance of having a normal or cool August. In other words, just because it's been a hot July doesn't mean it's a sure thing that August will follow suit.

If you live in Wenatchee (blue pyramid), the numbers are a bit different.  A hot July has a 54% chance of being followed by a hot August.  However, Wenatchee also has a 27% chance for a cooler than normal August after a hot July. Those of you in the Lewiston area (red pyramid) also have about the same chance of a hot August (53%), with the next best chance being a normal August (37%). 

Even as we start off the month of July at near record high readings, it doesn't even guarantee how the rest of the month could go. July 1926 in Spokane was the hottest first half of July ever. The first 14 days were marked by temperatures in the 90s with 3 days above 100°F. However, as the month progressed the temperatures rapidly cooled off and returned to normal levels.  A few of the days failed to even warm into the 80s.  The thing to take away from this is even if the month starts off at record setting levels, there's no sure bet that it will end up the same way.  

Wednesday, July 2, 2014

What's the hottest day of the year?

The answer to the question of "what's the hottest day of the year?" depends on where you are.  And the differences may surprise you.

The National Climatic Data Center (NCDC) created a neat map that shows the average date of the hottest day of the year across the lower 48 states.  Now some people might guess that it would be the same no matter where you are located.  Others might think that latitude comes into play.  But the answer is much more complicated than that.


The first thing you notice is that there is quite a bit of variance.  For instance, if you live in El Paso (western Texas), your hottest day is usually in the latter half of June.  But over in Houston (eastern Texas), your hottest day isn't until mid August.  That's a big difference.  Which leads to the question:  what causes these variations?  They're actually rather explainable.  Let's look at a few.

The western U.S has the most drastic variability.  Much of the West has the warmest date around the 1st of August, give or take a week.  But there's a ribbon of purple colors along the west coast from Newport WA down to San Diego.  Those are late August and September.  What's up with that?  Well, most of the west coast of the U.S is blanketed by fog and low clouds for much of the summer.  

MODIS Visible Satellite image 20 July 2013


The cold Pacific waters are responsible for making the fog, and then the hot inland temperatures act to pull the fog onshore.  We all know about how cold it can be in San Francisco in summer.  


But as summer wanes, that "onshore flow" lessens.  So the fog isn't as extensive along the coast.  Also, we often see high pressure move into the western US behind a cold front.  This reverses the winds, and causes off-shore flow (winds blowing from east to west).  This not only pushes the fog away from the coast, but brings the warm air from the interior to the coastal towns. So some of the warmest weather on the west coast is actually in September.  Here's the normal temperatures for San Francisco.  


The peak of the brown shading (normal temperatures) is in early September.  And the hottest day ever at San Francisco Airport was 103F on Sept 14th, 1971.

Cliff Mass has a great blog and some of his entries do an excellent job of describing and explaining the effect of off-shore flow.


So what about the desert Southwest?  Why is late June and early July the hottest time of the year for Arizona and New Mexico?  The answer is what we call the "Southwest Monsoon".  During May and June, the desert Southwest is generally sunny, hot and very dry.  But by mid-July, moisture from the south (i.e. Mexico) routinely moves into the Southwest US, resulting in frequent clouds, showers, and thunderstorms.  The satellite image below shows an example of all the thunderstorm activity over the desert SW on 1 Aug 2013.

MODIS Visible Satellite image 1 Aug 2013


All of this cloudiness tends to keep temperatures a little cooler.   Here's the average temperatures for Tucson.


The brown shading shows the "Normal" temperatures.  And you can see that they do indeed peak in late June.  It's still hot in July through September, just not quite as hot as late June.