With the recent cloudy and wet weather of late (at least for this time of year), some folks are asking when will summer arrive? Others may be wondering about the status of fire season. We will look into these topics in this blog post.
Before we get to recent weather, let's briefly recap the longer term conditions as observed going into fire season.
October-June dryness
Long term precipitation deficits still exists for much of northern Washington into the north Idaho Panhandle.
And the latest soil moisture anomalies reflect this long term dryness.
So despite some recent wet weather in the Cascades and across NE Washington into the North Idaho Panhandle soil moisture remains dry. This is reflected in the latest drought monitor issued today.
Recent changes
But the weather pattern in late June and early July has changed. There have been several rounds of showers and thunderstorms in the Cascades and across northern Washington into the Idaho Panhandle. Here is a map (click image to enlarge) showing observed precipitation amounts since the first day of summer (June 21st)
 |
| Observed precipitation from June 21st-July 10th, 2019 |
In the Cascades most areas have been wet with most areas picking up between 1.00-2.25" of rain. The northern valleys and mountains have been wet in some places (3.75" Metaline Falls) while not as wet in others (0.33" near Colville and 0.24" Omak).
Fire Potential update
Now the recent period of wet weather, as well as below normal temperatures to start off July has resulted in a slow start to the fire season with above normal fuel moisture in the timber. This also implies below normal potential for forest fires for the time being.
If you want to see more, read on below to see data for different parts of our region otherwise skip down to the next section (A look ahead).
We will take a look at the Cascades, NE Washington, and the north Idaho Panhandle. The following graphs are courtesy of the GACC (Geographic Area Coordination Center) which monitor fire potential across the country.
Here is a map showing the areas in Washington we will take a closer look at. We will look at NW05, NW08, and NW09.
 |
| Map of NWCC Predictive Service Areas (PSA) |
NW05 (East Slopes of the Central and Southern WA Cascades)
 |
| Graph of 100 hour fuel moisture for NW05 (East Slopes of the Central and Southern WA Cascades). Red line is observed. Blue line is forecast. Light gray lines are max and min observed. Dark gray line is average. |
The time period runs from May 1st-August 1st. Dark gray line in the middle of the vertical bars is average fuel moisture from historic data. The red line is this years observed value while the blue line is forecast conditions out the next 10 days. As you can see fuel moisture is running above normal and forecast to remain that way.
It is interesting to note the lowest values of fuel moisture were in early May when values were near record values for the time of year.
NW08 (East Slopes of the North Cascades, Okanogan Valley and Highlands)
 |
| Graph of 100 hour fuel moisture for NW08 (East Slopes of the North WA Cascades, Okanogan Valley and Highlands). Red line is observed. Blue line is forecast.
Light gray lines are max and min observed. Dark gray line is average. |
Similar story. Fuel moisture is running above normal but the forecast has conditions becoming near normal in 7-10 days. We will see about this. Back in early May values were near record dry levels for that time of year.
NW09 (Northeast Washington)
 |
| Graph of 100 hour fuel moisture for NW09 (NE Washington). Red line is observed. Blue line is forecast.
Light gray lines are max and min observed. Dark gray line is average. |
Similar story. Fuel moisture running above normal, some drying is forecast but still remaining slightly above normal. Just like the Cascades fuel dryness was near record dry levels for the time of year back in early May.
NR01 - North Idaho Panhandle
 |
| Graph of 100 hour fuel moisture for NR01 (Northern ID Panhandle). Blue line is observed. Gray line is average. Red line is minimum observed. |
A different color scheme on this graph with the blue line being the observed value. Same story here with fuel moisture above normal.
Now these graphs do not address grass and brush. We have already seen grass fires over parts of the Columbia Basin and around Elmer City.
A look ahead
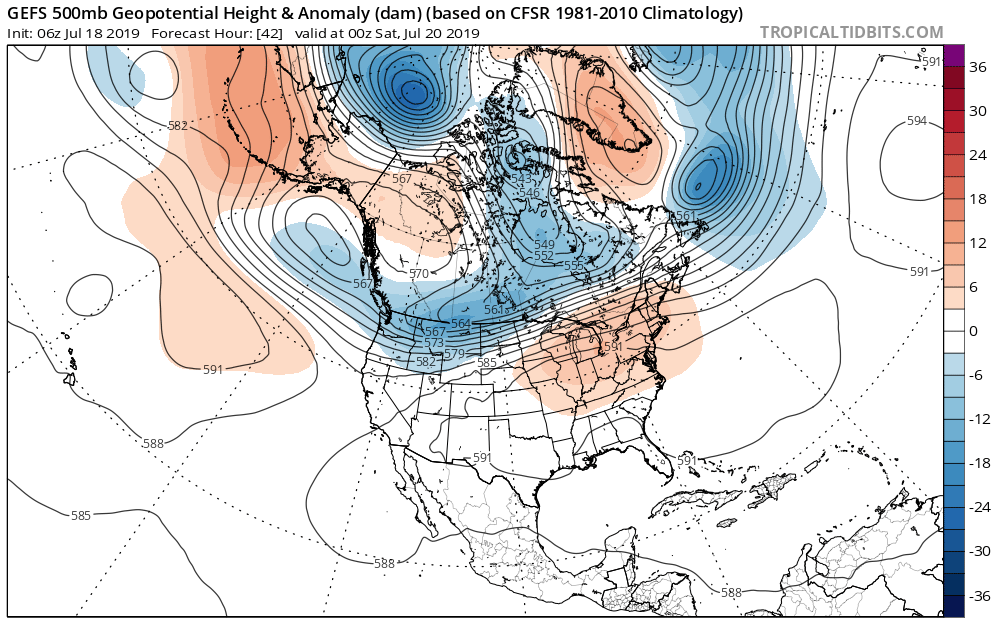
So any hot and dry weather on the horizon? Not likely as a large trough sets up over the region around the middle of next week. Image below is for July 19th.
 |
| GEFS Forecast of 500mb heights and anomaly valid 18z (11 AM PDT) Friday, July 19th |
This will likely deliver another round of below normal temperatures and maybe even some showers. The 8-14 day outlooks from the Climate Prediction Center favors this.
 |
| CPC 8-14 day temperature outlook issued July 10th, 2019 |
 |
| CPC 8-14 day precipitation outlook issued July 10th, 2019 |
And latest CFS model shows the month of July likely finishing COOLER than normal for much of the Inland NW. Quite warm in Alaska!
 |
| CFS Model Forecast Temperature anomaly July 2019 |
And now precipitation. Wetter than normal over western Washington, our northern mountains, and especially British Columbia. This should greatly reduce our chances of British Columbia smoke making it into our region this summer unless a dramatic weather change arrives in August.
 |
| CFS Model Forecast Precipitation anomaly July 2019 |
So how about August? The latest CFS model is going for normal temperatures and precipitation suggesting our current pattern may stick around. However other climate models are leaning towards a warm August with a wide range in solutions for rainfall totals. So at this time there is low confidence with how long this pattern will last so stay tuned.
Alaska fires
There is one area that has had several fires, and that is Alaska where over 1.3 million acres have burned so far this year. Several large fires are burning as the map below shows (bottom left part of image).
 |
| Map of active large fires July 11th, 2019 |
Here is a picture of one of those fires burning on June 29th, 2019.
 |
| The Rainbow 2 Fire burning approximately 15 miles west of Delta Junction on June 29th, 2019. Photo courtesy of Alaska Division of Forestry |