Showing posts with label Idaho Panhandle. Show all posts

Saturday, January 14, 2017

A wintry mess before the very wet and milder arrives next week?

So as we mentioned in our previous blog post, we are expecting to finally break out of this latest cold and dry weather pattern by early next week. So what is going to be responsible for this change? Here is a look at the current weather maps which are supported by what we see on satellite (a good sign if we want to follow a particular weather model):

500 mb map (left) with Integrated Vapor Transport (shows atmospheric rivers denoted by bright colors). Water vapor satellite imagery  on right. 
The most noticeable things on the left chart are the large high pressure ridge centered over the Inland Northwest (Large H) as well as the atmospheric river developing north and west of Hawaii. Over the next several days we expect the presence of the high to persist over our area. This means more fog, low clouds, and very cold temperatures in the valleys with light winds. This is because high pressure systems in the winter typically lead to strong inversions (temperature increasing with height). This is especially true when there is widespread snow cover over an area and clearing skies. This is certainly the case right now as we have seen many mornings recently with sub-zero temperatures and mainly clear skies. Here is a look at just how strong the inversion was this morning at our office.

1/14/17 4am weather sounding at NWS Spokane. The red line shows how the temperature varied with elevation. The farther to the right the red line is the warmer the atmosphere is. Notice how the temperature increases all the way from the ground up to 4700'. That is what we would call a strong inversion. 
So why are we telling you about this inversion? Because what happens between now and Monday night will be critical into producing an accurate weather forecast. But more on that later. So first, what do we expect to happen to that atmospheric river forming north of Hawaii? By Monday night here is what most of the weather models are showing.
Atmospheric river position 10 pm Monday 1/16/17
According to this we should see the ridge being rapidly replaced by the atmospheric river moving in from the Pacific. Not only is this air stream moist, but it will be warm as well. So that should mean we would see a rapid transition from the current chilly air mass to a much milder one, right?. In other words we should see any threat of snow changing to rain and probably in a short amount of time. But if only it were that easy! This upcoming system will likely provide us with all sorts of weather conundrums simply based on the inversions we showed you earlier.   Here is an example from Moses Lake.

Weather Sounding from Moses Lake 4am Tuesday with the freezing line denoted in pink.
So as the precipitation arrives it could begin as all snow as the entire atmosphere will have temperatures below freezing. But as the atmospheric river comes into the area (being ushered in by southwest winds of 30-40 mph 3000-10,000 ft above the ground) the temperatures above the ground will warm faster than those near the ground and this will create what we call a melting layer or warm nose of air aloft. What this means is any snow which forms in upper portions of the atmosphere will melt as it traverses the melting layer. If the melting layer is deep enough it will melt anything which falls into it. If it's not deep enough it will only partially melt the snow falling into it. In this case we are looking at a melting layer around 4000-5000' thick which should be plenty deep to melt most of the snow falling through it. That's not the whole equation though. What happens after that depends on how deep the freezing layer near the ground is. For the sounding above the freezing air near the ground is around 1500' thick so the question is "is this deep enough to completely freeze what melted before hitting the ground"? If the answer is yes the melted snow would completely refreeze producing sleet or ice pellets. If its not deep enough the melted snow will not refreeze and instead fall as a very cold rain which can easily refreeze once it contact a sub-freezing object on the ground. Here is a nice weather schematic the NWS office in Omaha created that shows the complexity of forecasting winter weather precipitation types.


So what does the profile in the Moses Lake sounding favor? That is always a tough question to answer as any perturbation in the strength/depth of the above ground melting layer and near ground freezing layer has a direct impact on the precipitation type.  If nothing were to change in the models we think this would lead to freezing rain. However the no change argument isn't one that often appears as much as we would desire. Since this event is still a few days away there are numerous answers as to what might occur. While we are confident we will see precipitation, we are far less confident in what the prevailing type of precipitation will consist of. Each model is advertising a different scenario. When we see such great differences we sometimes like to defer to what we call an ensemble model solution. This is were we take the same initial model and introduce very small changes at the very beginning of the run. These small initial changes can lead to vastly different solutions as you get farther into the forecast. So here is a snapshot of the various precipitation chances associated with the incoming weather make during the Tuesday morning commute.
4-panel ensemble solution for the precipitation type on Tuesday morning. Upper left corner=Sleet chance, upper right=Snow chance, lower left=freezing rain chances, lower right=measurable precipitation chances

The image above is about as messy as a weather forecast can get around here. As for sleet or ice pellets (upper left), we'd expect to see the best chances to occur over the western Columbia Basin and into the northern valleys east of Omak. The snow chances (upper right panel) would be highest near the north Cascades, northeast Washington, and over the northern Panhandle. Meanwhile the threat of freezing rain looks most prevalent over the remainder of the the Inland Northwest. But that is what the latest ensemble model runs suggest and this could change significantly as the event nears. Previously we were expecting to see a lot more snow with a brief changeover to freezing rain and then all rain. If we see snow first the freezing rain impacts could be somewhat mitigated as freezing rain falling onto fresh snow has much less impact on driving conditions then freezing rain falling onto bare pavement. Stay tuned to the latest changes in this evolving portion of the forecast.

Eventually (how long is uncertain) the atmospheric river will bring the warm moist over the entire region and mix it down to the ground with the most of the snow or freezing rain chances remaining near the north Cascades or over the far northern valleys. Here is what the temperature profile looks like for Moses Lake at 10 am Tuesday. Notice it's entirely above freezing which means we would see all rain.

10am Tuesday temperature profile for Moses Lake
Once the lower atmosphere warms above freezing we expect it to remain above freezing through the end of the event.The end of the event will likely consist of a good amount of time as the atmospheric river remains fixed over the area. Here is the expected position on Wednesday afternoon and then on Thursday.
Atmospheric River position on Wednesday 1/18/19 4pm.
Atmospheric river position by Thursday morning 1/19/17

That means the atmospheric river will be over the region beginning Monday night and persisting into early Thursday. Needless to say that can result in a lot of precipitation. Just how much are we expecting? Here are four distinct model runs.

72 hour precipitation ending 4 pm Thursday
Surprisingly there is very good agreement for a forecast this far out. We are quite confident that the precipitation over the western Columbia Basin and in the lee of the Cascades is a little bit overdone, and near the Cascade Crest and over north Idaho it might be underdone. Nonetheless these are some very impressive precipitation amounts. Looks like the eastern third of Washington and the Idaho Panhandle should generally see anywhere from 1.50"-3.00 inches. If there were no snow on the ground this alone could produce some issues with low-land flooding and perhaps some ice jam flooding as the ice breaks up on area rivers. However that is not the case as we have an appreciable amount of snow on the ground. Here is a look at the approximate amount of water tied up in the snow pack.


That is quite a bit of water or potential runoff sitting on the ground and will only add to the runoff totals. Based on the forecast temperatures, we expect to see temperatures remaining above freezing from Tuesday through much of Thursday (including nighttime low temperatures). The above freezing temperatures will combine with breezy winds resulting in a great setup for appreciable melting. The best melting potential will occur the SE third of our forecast area with the least amount near the Cascades and far northern valleys. We still expect to see most if not all the snow to melt over the Palouse, LC Valley, and eastern Columbia Basin. So combining the expected rainfall with the water from the snow melt could equate to up to 2.50 to nearly 5.00 inches of water which could potentially runoff. This increases the odds for flooding appreciably. Here is a map of where we anticipate the greatest flooding problems to occur.


We expect most of the flooding issues will involve low-land flooding, ice jam flooding, and urban flooding (think snow clogged storm drains...clear them now if you can!). Small rivers and streams could also flood, especially over the Palouse and nearby areas. As of now we are not expecting any mainstem flooding, however that could change especially if we melt more snow than expected.

If we look into the longer range weather forecasts, we don't expect to totally dry out, but we will cool considerably. Not down to current levels, but certainly enough to refreeze what doesn't melt. The pristine snow cover we have over us will look completely different by next Friday and could feature hard snowpack and frozen slush.

Please stay tuned to the latest forecasts for this upcoming situation...it will likely be a messy situation and is certainly subject to change. Oh yes...the countdown to spring is now 64 days and counting.

Monday, March 21, 2016

UPDATED....Is a significant snow event possible for Spokane,Coeur d'Alene or the Palouse late tonight and tomorrow morning?

So as we talked about yesterday, an unusually tricky weather scenario looks like it will unfold over the Inland Northwest. So what are we fairly certain about? We are fairly confident that a slow moving upper-level low-pressure system will take up residence over the Inland Northwest and produce a band of moderate to locally heavy precipitation. The big questions to answer are where is this band going to set up and will it cool the atmosphere enough that we could see some significant snow. The setup producing the unusual event looks quite similar to what we discussed in our previous blog. We still expect to see strong lifting associated with a slow moving upper level low parked somewhere over eastern Washington. Notice the green shaded area (representing upper-level moisture) remains parked over eastern Washington and the central Idaho Panhandle through much of Tuesday.


500 mb pattern 2am Tue-5pm Tue
The lifting from the low will be accompanied by plenty of moisture and instability which should be perfect for producing a band of precipitation. Just how much precipitation are we talking about? A lot to say the least. The areas in purple represent totals between 0.50-1.00 inches of liquid and the reds and yellows equate to amounts between 1.00-1.50 inches. This is for the 12 hours between 2am through 2 pm Tuesday. Notice the band of heavy precipitation has eeked farther north than what we were looking at in yesterday's forecast and blog.

Latest 12 hr precipitation forecast 2am Tue-2 pm Tue

Previous 12 hr precipitation forecast for 2am Tue-2pm Tue

We still highly suspect that whatever verifies from a precipitation standpoint will more closely resemble the top two panes showing a heavy east-west oriented band vs the more poorly defined precipitation blob in the lower two panes.

Since the forecast is nearing in time we can also use one of our favorite tools called the HRRR (a rapidly updating model that runs hourly and can ingest current weather conditions). Let's see what the latest run of it says. The loop below is a simulation of what the radar is expected to look like. Green and yellow shading indicates where the heaviest precipitation is expected.

Radar simulation for Tuesday morning

So this also boosts our confidence that this event is going to occur. Each subsequent run of this model continues to show a similar radar formation (with small variations in location).

Now the largest problem remains is will the temperatures cool down enough to support snow. The models vary in this regard and there is a fine line as to whether or not snow can fall and then whether it will get heavy enough so it can accumulate on roads. The odds of rain changing to snow over the Inland Northwest look fairly good especially over Idaho and southern Spokane County and northern Whitman County. However a tougher question to answer is will the snow be able to accumulate on the area roads? If the snow gets heavy enough the answer is yes, however if not, most of the accumulations will occur on grassy surfaces. So once again lets look at the plume diagrams to see how much snow 27 different model runs produce over Spokane, Coeur d'Alene and Pullman.

Spokane plume diagram shows snow totals ranging from 0.0 - 2.5" with an average around 0.3" 


Coeur d'Alene plume diagram shows snow totals ranging from 0.0 - 5.3" with an average around 0.8" 

Pullman plume diagram shows snow totals ranging from 0.0 - 3.5" with an average around 0.5" 

Generally speaking, these values are on par with what the models were showing last night, however with the band moving further to the north, the snow totals in Pullman are trending lower. Motorists are still urged to check the latest forecast before venturing out in the morning and be prepared for a potentially snowy commute. Here is our latest snow forecast.

Snow forecast for Tuesday (issued 9 pm Monday )


1145pm Monday Update....the band of precipitation was beginning to take form. Our confidence is growing the moderate to locally heavy precipitation band will develop. Still not sure if heavy snow will accumulate.

1147pm radar imagery. Note heavier precipitation developing between  Davenport and Ritzville. 


Is a significant snow event possible for Spokane,Coeur d'Alene or the Palouse Tuesday morning?


Although the weather of late has been quite wet, the overwhelming majority of the precipitation has fallen as rain (or melting snow) in the valleys of eastern Washington and north Idaho including the Spokane/Coeur d'Alene area and the Palouse. That might change however as an unusual weather pattern materialises on Tuesday morning resulting in the possibility of significant snow. So what is the weather pattern which might lead to this unusual snow? To get significant snow in the valleys this time of year you need several things. First, you want to have a fairly strong upper-level trigger. In this case, we will be dealing with a slow moving upper-level disturbance or vorticity maximum.

500 mb pattern 2 am-2 pm Tuesday

The emphasis is on slow. The loop above shows the disturbance quite nicely between 2am-2pm Tuesday. The green area represents where the forecast model is placing the best moisture. Notice the feature also looks like a semi-circle indicating a tight circulation in the upper atmosphere which should lead to increased upward motion.

Another ingredient we like to see to enhance this upward motion is deep instability. This helps enhance the upward vertical motion between the ground and the upper atmosphere. So will the atmosphere be unstable? You bet. The orange and red shading indicates where we expect to see the most instability (however it's unstable everywhere across the region.
Lapse Rates through the mid-atmosphere 2am Tue
So couple the presence of the instability and the upper-level disturbance and here is where one model solution suggests we will see the greatest lift. Areas in purple and light purple are where the models expect to see the greatest ascent and thus the best potential for precipitation.
Upward motion through the mid-atmosphere 2am Tuesday

Finally, you need an atmosphere which is cold enough to support snow. This is the least confident part of the forecast. Model solutions are suggesting that the temperatures before the precipitation arrives early Tuesday will be above freezing, but then they slowly fall as the precipitation intensifies during the morning at least over a very small area (denoted in light or dark blue).

8am Tuesday Temperatures

So we have the ingredients in place for a heavy precipitation event (albeit fairly localized). Now the question is where will this band of precipitation set up and will it become heavy enough that it can produce accumulating snows in the valleys. That is a tough question to answer since there has been considerable model variability. What we can gather is more often than not the model solutions have depicted a northwest-southeast or west-east oriented band of precipitation similar to the two panes in top portion of the image below. Some of these amounts are quite impressive. The areas in purple show precipitation amounts above 0.75 inches and the red areas are showing more than an inch. So is it possible that most of not all this will fall as snow? It is certainly a possibility. 

12hr precipitation amounts forecast between 2am-2pm Tuesday
So just how much snow are we talking about?  Well here is a plume diagram showing 27 different model possibilities or solutions for the Pullman/Moscow area. While some of the models are hinting at a little more than a trace of snow, the most impressive solution is showing nearly 8 inches! The average snow amount from all the variations is just over 1" of snow.  For the Spokane area, the forecast is nowhere close to as snowy as for Pullman. The maximum snow forecast is around 2.25" but the average is around a quarter inch. That's a lot of variation, to say the least. 

Plume Diagram for snow for Pullman (Click image for larger view)


Plume diagram for snow for Spokane (Click image for larger view)

So what do we expect to happen? We are fairly confident we will see a band of moderate to locally heavy precipitation develop on Tuesday morning. Again the question is where will this occur and will the atmosphere be cold enough to support heavy snow? The other variable is will the ground be cold enough allow accumulations to occur on the roads? If the snow gets heavy enough (quite possible) we suspect the answer will be yes. Motorists are urged to prepare for the possibility of winter driving conditions for the Tuesday morning commute. Chances are the afternoon commute will be much easier as any threat of accumulating snow diminishes. Hopefully, as the event nears our confidence will grow as to where we expect to see the greatest risk of significant snows. 


Saturday, October 3, 2015

Is the end of fire season expected soon?

So while we can't argue that the worst of fire season is behind us, it should be noted there are still fires burning across portions of the Inland Northwest. Here's is what satellite information was showing on the last day of September:

MODIS Visible Satellite Imagery from 9/30/15

While these fires are far from the raging infernos we saw earlier this summer, it's still rather impressive for the end of September or beginning of October.  However, as we all know this year is different. First off, look at these precipitation totals since the beginning of April

Idaho Precipitation % of normal 4/2/15-10/1/15

Washington Precipitation % of normal 4/2/15-10/1/15
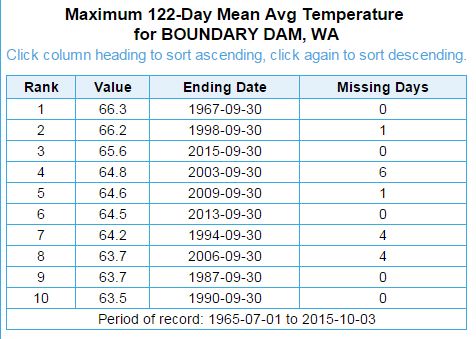
That is a lot of red and dark red shading over the Inland Northwest which correlates with meager precipitation amounts ranging 25-70% of normal. That's pretty dry. In fact, since the beginning of April through the beginning of October it was the driest period on record for both Spokane and Boundary Dam, WA (extreme NE corner of the state).

So combine the record dry conditions with nearly record warmth for both sites and it is no wonder the fire season has been so long. Here is a look at the temperatures for both sites.

So obviously record warm and dry conditions led to our active fire season, but unlike a typical year, things just aren't winding down as quickly as we are accustomed to. Climatologically, the days of active fires will be limited. We say that because the shorter days are leading to cooler temperatures and higher relative humidity levels  (both items are generally detrimental to good fire growth) while the chances for measurable precipitation are rising quickly. Climatologically the chance of measurable rain ranges from 20-25% over locations where the fires are currently burning. However by the end of the month those chances nearly double. So despite these facts, look at the latest fire danger ratings for the Inland Northwest:

Current Fire danger ratings
That map shows the fire danger is still high (yellow) or even very high (orange) across a sizable portion of the Inland Northwest, with moderate conditions (light green) found everywhere east of the Cascades. So what does that mean? According to the Wildland Fire Assessment System (WFAS) a high fire danger means, "All fine dead fuels ignite readily and fires start easily from most causes. Unattended brush and campfires are likely to escape. Fires spread rapidly and short-distance spotting is common. High-intensity burning may develop on slopes or in concentrations of fine fuels. Fires may become serious and their control difficult unless they are attacked successfully while small.

So is this danger level unusual for the beginning of October? Since 2006 (earliest year of  the graphical archive), the current fire danger has only been matched one time. That was in 2012. All other years saw low to moderate fire danger ratings across the area.


So what was the fire weather like in 2012? This satellite picture tells the story

MODIS Satellite imagery from 10/4/12

Just like this year, there were quite a few fires burning during the beginning of October. In fact, based on the satellite image, they were much bigger and included the Wenatchee Complex (southwest of Wenatchee) and the St. Mary's Misson Rd fire south of Omak. So what happened that year? The dry weather and fires continued to burn through the middle of the month, but several days of rain (not necessarily heavy) and cooler temperatures put an end to that fire season.

So what did the weather pattern look like for the end of that fire season? Well leading up to the end of the fire season, the upper-level pattern exhibited a large ridge parked right off the BC/WA coast with dry northwest flow over the region. Also, note the low-pressure area off the California Coast.

Early October 2012 500 mb pattern. 
So how does the pattern look for most of this week? Although it's far from identical, it does have some similarities, including the low near California, and the ridge over the Pacific Northwest.
500 mb pattern for Monday afternoon (10/5/15)
So what did the weather pattern that led to the end of the fire weather year in 2012 look like? The ridge broke down quite quickly and was replaced swift southwest flow into the Pacific Northwest and a deep low over the Gulf of Alaska. Again this brought cooler temperatures, periods of light rain (moderate in places), as well as significant cloud cover.
Mid-October 2012 500 mb pattern (Oct12-14)
How about this year? Is anything similar expected? Again although not a perfect match, there are some good similarities including a deep Gulf of Alaska low and deep southwest flow pointed into the Pacific Northwest from the eastern Pacific.
500 mb forecast for Oct 10, 2015
So how is our confidence in this solution and will this be the end of the fire season?  There are a few additional tools we can look at. One of the more interesting ones is called the 
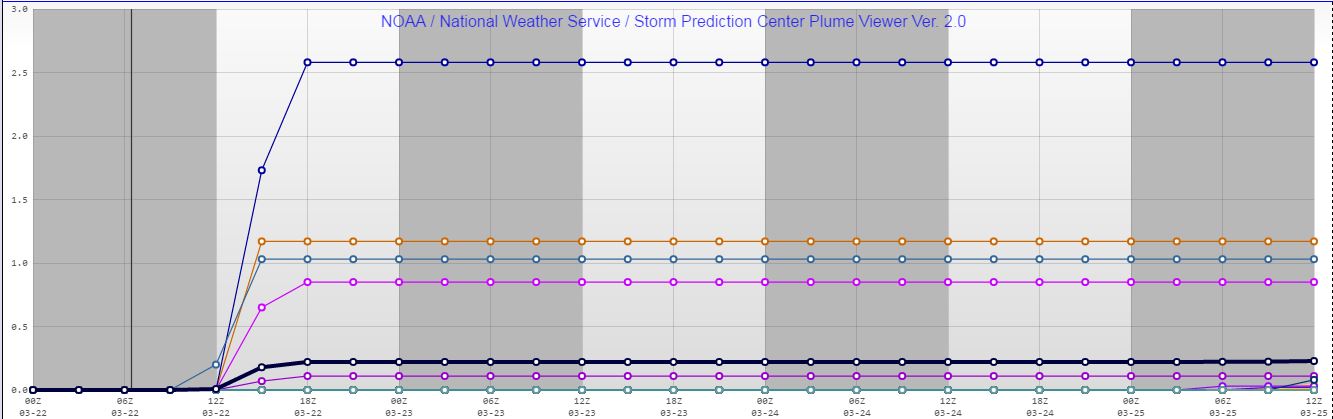
NOMADS ensemble probability tool. This tool queries 21 GFS ensemble members or model runs and calculates the chances of any given parameter. Using this tool we can look at things such as what is our chance of seeing over a tenth of an inch of rain in a day?  When asking that particular question, here is the answer for the Grizzly Complex located over northern Shoshone County, ID.

The probability of seeing 0.10" of rain or more in 24 hrs over northern Shoshone County. 
So if you key in on the clustering of the blue bars, you can see that there is some consensus that by next weekend (10/10 and 10/11) that the weather pattern will support an increasing chance of rain (it peaks at 25% for the 24 hrs between 5pm Saturday through 5pm Sunday). Notice also that there is a small chance of light rain during the middle of the week.

Stay tuned and we shall see if this will truly be the end of a historically warm and dry fire season across the Inland Northwest.


Friday, May 29, 2015

Severe Weather Monday?

You may have heard about the potential for severe thunderstorms on Monday, June 1st.  We've been talking about it in our forecasts for the past couple of days.  So how likely is this?  Let's take a look at a few things.

First, thunderstorms rely on instability.  There's several ways that meteorologists assess the instability of the atmosphere.  One of the more straightforward methods is called the Lifted Index, or LI.  There are more sophisticated methods, but we'll stick with the LI for simplicity sake.  Essentially, if the LI is less than 0, then the atmosphere could be unstable, leading to thunderstorms.  The more negative the LI value is, the stronger the thunderstorms could be.

So here's 4 LI forecasts for Monday afternoon.

Lifted Index forecasts from four models valid Monday afternoon, 1 June 2015

The yellow, orange, red, and pink colors show areas of LI less than 0, with pink showing the areas with LI less than -4.  So as you can see, these 4 models all show instability on Monday afternoon, with some areas of rather strong instability (pink shading).  The exact location varies a bit, but in general they agree on the southern Idaho panhandle.  So from an instability standpoint, Monday certainly looks favorable for strong thunderstorms.

Another parameter we look at is wind shear.  We look at this over a layer of the atmosphere, typically from the surface up to about 4 miles.  Shear measures the change in wind speed as you go up.  For strong storms, we want lots of shear.  This helps the thunderstorm develop.  Weak shear means the storms will be more vertical, which isn't as good for strong storms.

Here's the shear forecast from the GFS model (the others are similar to it)
Forecast 0-6km Wind Shear for Monday afternoon, 1 June 2015

The colors of purple indicate shear of less than 30 knots.  This isn't very strong.  The cyan color shows shear of 30-40 knots, which is moderate, but still not strong.  So the shear forecast doesn't look very promising for strong thunderstorms.  

We also need a "kicker", something to get the ball rolling so to speak.  Often times this can just be the sun warming the ground.  So let's see what the forecast looks like for clouds.

Relative Humidity Forecast for Monday morning, 1 June 2015

This is the Relative Humidity forecast from the GFS model for Monday morning.  The green shading shows the atmosphere nearly saturated, which usually means clouds.  As you can see, there's the potential for a lot of clouds Monday, which would limit surface heating from the sun, and thus diminish the thunderstorm chances.

But there are other ways to make thunderstorms without sunshine.  A strong low pressure system can do the trick.  And that's what is causing the spiral of green off the Oregon coast in the above image.  This low could bring enough "dynamic" lift to kick off thunderstorms.  In fact, for  strong/severe storms, we usually want both (sunshine and strong low).

Here's the model precipitation forecast from 4 models.  Again, there's fairly good agreement.  These would seem to indicate that the best activity could fire off in the Panhandle and quickly move into western Montana.

Forecast precipitation from four computer models, valid Monday evening 1 June 2015


This is still a few days away, so there's still time for the models to refine their forecast.  Timing will be critical.  If the low comes in too fast, there will be too much clouds; too slow, and the sun will be setting before things can get going.  So as always, stay tuned to the forecast.


Wednesday, May 20, 2015

Is it still looking wet for this Memorial Day Weekend?

So a couple days have passed since our last blog post about the weather outlook for the Inland Northwest for the upcoming Memorial Day weekend. Consequently, our confidence in what sort of weather to expect should be increasing. Recall that in the last post, there were suggestions that this could be a very wet weekend. In fact, perhaps the wettest Memorial Day weekend since 1997 and the second wettest on record (since 1970). So is that still the case?

Saturday 500 mb height
Above is the 500 mb map for Saturday from the GFS. This is a similar setup to the maps we explored earlier this week with a deep low centered over the Pacific Northwest. So is this GFS run an outlier or do other model agree with the solution?

4 different models showing 500 mb heights for Saturday (upper left model did not come in fully)
Here's is a look at 4 models compared to each other and they all show a low focused somewhere over the Pacific Northwest on Saturday. So where is this low on Sunday?


500 mb maps for Sunday
Again there is great agreement that there will be a low focused somewhere over the Pacific Northwest. The top 2 models take the low into southern Oregon, whereas the bottom two models drop the low into southern Oregon. Now, what the positioning of the low on Memorial Day?

500 mb maps for Monday
Again all the models keep the low over the region, however, the consensus is to drop the low south of the Washington/Oregon border.

So our confidence in this event is quite high. We are certain this low will form and move over portions of the Inland Northwest however how long it will remain over the area and where its precipitation  band will set up is the big question. Looking at the GFS for the Saturday and Sunday yields a significant northwest to southeast orientated band of precipitation.

48 hr precipitation amounts for Saturday-Sunday (latest model run )
This is quite similar to the previous model run we looked at a couple days ago(see below). Both model runs show a similarly oriented band of precipitation, however,  the latest version has the band a little farther to the west leaving places such as Sandpoint and Colville much drier than the previous forecast.

Rainfall forecast for Saturday and Sunday (Monday's model run)
Obviously wherever this band sets up will determine who gets a lot of rain and who doesn't. If we decide to consult another model solution it also shows a similar NW-SE band setting up, but this time it's displaced even further west. If this solution were to pan out even Spokane would miss out on the bulk of the rain as would the Silver Valley. 

Another Saturday-Sunday 48 hr precipitation forecast

So given these uncertainties it will be hard to pinpoint exactly where the band will take up residence. This is where ensemble model forecast can sometimes help to pinpoint the band (s) of heavy precipitation. So once again referring to the GEFS/NAEFS ensemble forecasts we see that it maintains a NW-SE oriented band of heavy precipitation as well. However the model has backed off from previous runs which suggested this would be a 99-99.9 percentile event for this time of year. Nonetheless the model still suggests this is potentially a 90-97 percentile event which is still significant. 

NAEFS/GEFS Ensemble 48 hr rainfall Sat-Sun


So what about the temperature forecast? We are holding onto our thoughts of hitting near 70° each day in Spokane this weekend, however if the band hits our area what will our temperature be? To say there is some uncertainty in this forecast would be an understatement. The 12z run of the GFS (dark blue line) has our high hitting the mid-70s that day. How about the 18z run of the GFS? A chilly mid-50s! That is about as uncertain as things can get. Its pretty much the same story for other parts of the Inland Northwest including Moses Lake (bottom meteogram)

Meteogram for Spokane
Meteogram for Moses Lake

This forecast remains a problematic one. Suffice it to say a good portion of the Inland Northwest is going to see a soggy beginning to the holiday weekend. Specifically where that will be, we still can't say with good confidence.  We expect the wettest day of the three-day weekend will be Saturday with a gradual improvement expected after that.