Friday, October 29, 2021

Does it seem like it's getting windier in the Inland NW?


One comment we've heard a fair amount is how windy it's been.  And people aren't just talking about the windstorms of Jan 13th and Mar 28th.  It just seems like there's wind every day.  "Oh great, just what we need.  More wind."  So has it really been windier than normal?  Does the data back up our perceptions?  If so, what is the reason for it?  And is this a trend we can expect to continue?  OK, lots of questions, so let's see if we can provide some answers.

First, we have to start with a caveat, namely, that archives of wind data don't go back nearly as far as temperature records.  Thermometers are fairly inexpensive and have been in widespread use for a long time.  As such, temperature records in the Inland Northwest go back into the early 20th century, and at some locations (like Spokane or Lewiston), go all the way back to 1881.  Unfortunately, wind anemometers (those spinning cups used to measure wind speed) are much newer to the scene of weather measurements, and generally they've only been found at airports.  So wind records are much less plentiful both in location and time.  Even so, we'll use what we have and try to draw some conclusions.

Has it been windier than normal this year?


To hopefully answer this question, we gathered all of the wind data we could find at a few different locations in the region.  As with most data studies, there's a couple of ways to slice and dice the data.  With wind, it really comes down to two types of measurements: the average wind over the entire day, and the peak wind gust of the day.  They're obviously related to each other, but not the same.  A thunderstorm can create a 50 mph gust on an otherwise calm day.  Or a steady 25 mph wind can blow all day without ever gusting much over 30 mph.  Which day is windier?  So we'll try to look at both measurements to glean our answers.

First we'll start at Spokane, mainly because it has the longest data record.  Peak wind gust observations for Spokane go back to 1969, while daily average wind speeds started in 1984.  

We'll start by looking at the number of days each year where the wind gusted to 50 mph or more.  


Looks like just about every year has 1 to 3 events with wind gusts over 50 mph.  And 2020-21 was no different, with a total of 3 events.  Notice, though, that there have been years with a few more windy days in Spokane.  2011-12 had 5 such days.  And looking back much further, the winter/spring of 1970-71 had 6 days with 50 mph or more, and 1971-72 had a rather amazing 12 such days.  

So let's bring it down a notch, and look at days with gusts of 40 mph or higher.  (The orange line is average of the previous 5 years)


Now we start to see a slightly different pattern.  1971-72 still tops the list, but there are now several other years that had a lot of windy days (greater than 40 mph gust).  1988-89 as well as 1989-90 were rather windy years in Spokane.  But then there seems to be a lull in the wind for Spokane for the 1990s and early 2000s.  Since 2005 however, the windy days have returned.  More recently, the >40mph days in 2020-21 totaled more than any year since 2013-2014.  So from that standpoint, yes, 2020-21 was winder than recent years.  But it certainly wasn't the windiest ever.

When we lower it down to 35 mph, things become a little more interesting.


Now, the really windy years of the early 1970s don't show up as well.  In fact, the top winters are now the 1988-89, 2013-14, and our current 2020-21.  So while some years may have a few really windy days (like 1971-72), they may not have many other windy days during the year.  Meanwhile, other years may have a number of days over 35 or 40 mph, but few if any over 50 mph.

Peak gusts don't always give a good indication of a windy day.  A thunderstorm or shower can cause a strong wind that lasts only an hour in an otherwise calm day.  Average wind looks at all hours of the day and averages them.  Below is the number of days in Spokane where the average wind speed was greater than 15 mph.


Similar to our results from looking at peak gusts, the 2020-21 as well as the 2019-20 years have been windier than any year since 2011-12.  So yes, it has been windier in Spokane of late than for the past 10 years.  Still, we see even windier years in the late 1980s as well as 1998-99.  So it would be wrong to say that this past year is the windiest ever in Spokane, or even that there is a trend for windier years.

Let's expand our study a bit, and look at other locations in the Inland Northwest.  The >40mph wind gust data from Pullman is interesting.


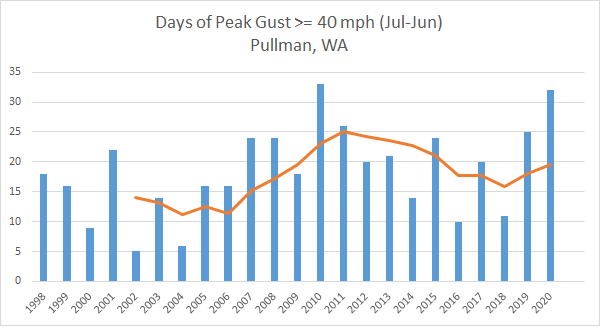
The number of days with gusts >40 mph at Pullman this past year (2020-21) was higher than all other years, with the exception of 2010-11.   So for the folks in Pullman/Moscow, it was a noteworthy year for wind.  Or was it?  Here's the number of days with wind gusts >45 mph.


Now the past year doesn't look so windy compared with earlier years.  What gives?  This would suggest that yes, Pullman/Moscow had a large number of windy days (over 40 mph), but didn't necessarily have an unusual amount of very windy days (over 45 mph).  

Further to the south in Lewiston, we see a similar signal as at Pullman.  Here's the number of days with gusts >40 mph at Lewiston:


Again, like Pullman, 2020-21 shows up as one of the windiest years when viewed with this metric.  And here's the number of days with peak gusts >45 mph:


Still, this past winter was one of the windiest, but not the windiest year on record.

At Moses Lake, the story is a bit different.  Here's the number of days each year with gusts >40 mph.


2019-20 is actually the clear winner for this category, with 2020-21 similar to several other years.

For average wind speed at Moses Lake, the past few years aren't really anything exceptional, especially when compared with the 1998/99 winter (a very wind La Nina winter) and the 2001/02 winter.


So in summary, in some respects, yes, it has been windier in the Inland NW recently than over the past 10 years.  But it would be wrong to say that "it's never been this windy".  Clearly the data shows that there have been windier years in the past.

Saturday, October 16, 2021

Firestorm 1991

 This Day in History!

Today marks the 30th anniversary of the event knowns as "Firestorm" in the Spokane Area. This event was characterized by a dry spell that occurred from late August through early October. The fall rains were late to arrive with fuels crispy dry and able to carry fire very easily. The event itself was driven by a strong cold front that produced extreme southwest winds with numerous ignitions from downed powerlines. Multiple fires broke out that quickly overwhelmed initial attack as strong winds fanned flames all across the Spokane Area. In this blog, we will re-visit Firestorm: news articles chronicling the event, the antecedent conditions, and of course the meteorology.

"Northern Spokane County like war zone"

Here is a portion of an article courtesy of the Spokesman Review detailing the conditions that day.

Article courtesy of Spokesman Review

Below are a couple maps summarizing the fires across Northeast Washington and North Idaho, followed by a zoomed in look at the Spokane area.


A summary of various newspaper articles from that day showed
  • 114 homes destroyed
  • 2 fatalities
  • 50,000 acres burned
  • 80 fires
Lets shift gears and talk about conditions leading up to the event, beginning with total precipitation leading up to the summer of 1991.  Below is a chart of precipitation accumulations at the Spokane International Airport for the water year. Each water year begins on the first of October. The month of October is when we will see mid-latitude storm systems move across the United States and is a good starting point for determining precipitation accumulations over an annual cycle.

The brown curve represents the average precipitation accumulation for the water year in Spokane and the green curve is the actual precipitation accumulation that fell from October 1st, 1990 through the day of Firestorm. Taking a quick glance, it's evident that precipitation accumulations followed the normal curve very closely; however, taking a closer look, it's also evident that a dry spell set up from August into the first half of October. Zooming into this period of the precipitation climate record (black rectangle above) and we see this:


July and August are typically our driest months of the year. The average, or normal, precipitation curve shows this with less than an inch of precipitation usually for this summer period. Then this curve starts to take more of an upward turn around mid September into October as weather systems off of the Pacific Ocean begin to usher in precipitation and shift out of fire season. It's clear to see zooming into this period that this precipitation was delayed. At the time, August through October of 1991 was the driest on record with only 0.18" recorded at Spokane International Airport -- 1.66" below normal!

How about the winds on the event? The next series of graphics are surface analysis charts showing mean sea level pressure (MSLP) through the event starting from the early morning hours on October 16th, 1991 into the afternoon. Keep in mind that the winds peaked during the late morning hours.

At 2:00 AM PDT


At 5:00 AM PDT


At 8:00 AM PDT


At 11:00 AM PDT


At 2:00 PM PDT


The storm intensified through the day, dropping from 994mb (29.35") at 2 am PDT to 984mb (29.06") at 2 PM PDT.  The storm produced the strongest winds in the late morning when the low was in close proximity to Eastern Washington and North Idaho.  Here are the observations from Spokane International Airport during the event.

Spokane International Airport observations for October 16th, 1991 from 7 AM to 7 PM PDT

Note the wind/wind gust columns with a peak gust of 62 MPH.  Also note the visibility and remarks where smoke and dust reduced visibility to as low as a quarter mile!

Where were you 30 years ago today?  If you lived in Eastern Washington and north Idaho at the time, you probably still have memories of that day.  Of course there have been many more Firestorms since 1991 (Carlton Complex, Okanogan Complex, Cold Springs/Pearl Hill, etc), but today we focus on what happened on October 16th, 1991.

Thursday, July 29, 2021

Record Hot July, Rain Anyone?

If you are hoping for some rain, we have good news for you!  But before we get there, another heat wave is about to hit the Inland Northwest which isn't good news for the ongoing drought.

Here is the latest U.S. Drought Monitor released today, July 29th.  Exceptional drought (D4) was covering a large portion of Eastern Washington and north Idaho.

U.S Drought Monitor released July 29th, 2021

Much of this drought locally is from very dry weather over the past 6 months which has had significant agriculture impacts to spring wheat, barley, and hay.

Percent of normal precipitation past 6 months


Combining the dry weather with lightning so far this July has led to multiple wildfires across the region.  The maps below show total lightning this month through the 24th.


And here is satellite image from July 23rd showing smoke from multiple wildfires over the region.

Evening satellite - July 23rd, 2021 courtesy of UW

Making matters worse has been the hot July, with temperatures over most areas running 4 to 8 degrees above normal so far this month.


And another heat wave is likely as we close out the month of July.  On Friday many locations will reach the triple digits, with the heat peaking on Saturday with near record high temperatures for the day.   Here the forecast high temperatures for Saturday as of this writing

NWS Forecast High Temperature for Saturday, July 31st, 2021 issued 230 PM July 29th

.

These temperatures will equate to many areas nearing, or exceeding their all time warmest July on record.  Here are some locations that have a good chance of the hottest July, with observed average temperatures for July 2021 so far shown.


Spokane Airport (GEG)


Bonners Ferry, ID


Lewiston, ID


Wenatchee Airport, WA


Omak, WA


Changes Ahead!

After all this talk of heat, fires, and drought, let's shift gears and talk about changes this weekend.  Some surfaces may look like this by Monday.


Yes, we have rain to talk about!  Models are pretty consistent in showing an increase in moisture moving up into our region.  This animation below (courtesy of College of DuPage) shows available moisture (also called precipitable water) and is NOT a rainfall forecast.  It's more of an indicator of available moisture for rain.

12z July 29th GFS run of Precipitable Water Standardized Anomaly valid July 29-Aug 3, 2021

Note that as values reach the blue and purple shadings on Sunday and Monday that it corresponds to the highest end of the legend at the bottom of the graphic.  This means there will be close to the highest amount of available moisture over our area as we can get for this time of year.

But the big question is will this lead to an abundance of rain and will there be thunderstorms?  We think most areas will get some rain, but amounts are uncertain.  This is due to the convective hit and miss nature of showers and thunderstorms.  Here is one ensemble forecast for rain totals for Coeur d'Alene, ID.

12z July 29th GEFS forecast of precipitation for Coeur d'Alene, ID through August 3rd, 2021

Note the large spread in possible rain amounts with the solid black line indicating the average values of near 0.25".  One solution gives as much as 1.50", while several show 0.20" or less.  

There will also be a chance for thunderstorms which could lead to new fires.  But the good news is that downpours should reduce the threat of new fires becoming large, and could help current fires with some much needed rain.

And there may be more rain for the middle to end of next week.  Here is the 6-10 day precipitation outlook from the Climate Prediction Center favoring increased odds of wetter than normal conditions.

Climate Prediction Center 6-10 day Precipitation Outlook valid Aug 4-8th, 2021


To summarize, hot temperatures to close out July will give some locations the hottest July on record.  Exceptional drought covers much of the region.  August will start on a different note, with an increasing chance for showers and thunderstorms.   With exceptional drought, don't expect this rain to even come close to ending the drought, but will at least bring a change in the weather and should help out the fire situation over the region.


Saturday, July 3, 2021

How hot did it really get in Spokane on 29 June 2021?

After our historic heat wave of 2021, it's time to take a look back and answer the question of just how hot did it really get in Spokane on June 29th.  Unfortunately, the answer does get a little sticky.  First we need to look back in history, as well as look at the topography of Spokane.

Temperature measurements in Spokane started in 1881, and these were taken in downtown Spokane.  The Weather Bureau office moved out to Felts Field in 1941, and with it, the official temperature of Spokane moved as well.  Observations were still taken in downtown Spokane, they just were no longer official.  Six years later, the Weather Bureau moved again, from Felts Field to Geiger Field (which would later become Spokane International Airport) on the West Plains of Spokane.  The official observation for Spokane has been at the airport since 1947.

Moving the observation from downtown to Felts Field probably didn't have much of an effect on the temperature readings.  Both locations are at about the same elevation.  But in the 1940s, the area around Felts Field was more rural than downtown, so there may have been a little less "urban heat island" effect.  However, the move to the West Plains in 1947 was significant.  The elevation of downtown Spokane is about 1890' above sea level.  Felts Field is at the 1953 foot elevation.  But the Spokane International Airport is up at 2356 feet, an increase of nearly 500 feet.  Using the thumb rule of 5.5 degrees per 1000 feet, that results in a difference of about 2.5 to 3 degrees between the West Plains  and downtown. 

It's important to note that downtown Spokane is about the lowest elevation of the entire metro area.  57th Avenue on South Hill is at about 2360', which is the same elevation as the airport. Same goes for Five Mile.  Even I-90 at Stateline is at about 2100'.  So your location in the metro area has a big effect on your temperature, just from the standpoint of elevation.

Additionally, your surrounding environment also has an effect on your temperature.  If you're downtown with lots of concrete and asphalt, the temperature is probably a few degrees warmer than if you're near the river or at a golf course.

Late July of 1928 was extremely hot across the Inland Northwest.  Triple digits were common just about everywhere for several days.  For many locations, July 26th 1928 became the hottest day on record at the time.  Prior to this event, the hottest temperature on record at Spokane was 104F, set in 1898.  That mark was tied on July 24th and 25th of 1928, after a 102F on the 23rd.  On the 26th, temperatures peaked as Spokane hit the 108F mark.  Some other extreme readings on that day included:

  • Omak  -  114F
  • Ephrata  -  112F
  • Lewiston  -  113F
  • Orofino  -  114F
  • Walla Walla  -  113F
The record of 108F for Spokane stood through for more than 3 decades of summers.  There were attempts, mind you.  The thermometer reached 106F in 1931 and 1934, and 105F in 1939.  Then in early August of 1961, extreme heat returned to the Inland Northwest.  This time the heat lasted only 3 days, but the extremes were more impressive.  Spokane once again touched 108F, tying its all-time record.  But recall that the weather observation moved up in elevation in 1947.  So which was the hottest day, 1928 or 1961?  Since downtown Spokane is typically a bit warmer than the airport, it's likely that 1961 was truly the hottest day.  And in fact, there was still a weather observation in downtown Spokane in 1961 and it reached 109F on 1961. This value was matched in Coeur d'Alene and St Maries.


Additionally, 1961 set the record for the hottest day in Washington state history, with a reading of 118F at Ice Harbor Dam (along the Snake River just east of Tri Cities).

So now we return to present day Spokane, and the 2021 historic heat wave.  We all know by now that Spokane Airport hit 109F, setting the all-time record for the city.  But was that truly the temperature that the citizens experienced?  After all, there's not many people who live at the Spokane Airport.  Thankfully, we now have a number of temperature measurements available to us to answer that question.


So while it was 109F on the West Plains, it was 113F at Felts Field.  So perhaps that should be the official temperature observation for Spokane during this heat wave?   Is that what most people experienced?  But then you notice that it there's quite a range of temperatures around the metro area.  It was 115F along I-90 in Spokane, but 108F near High Drive, and only 106F in Opportunity/Spokane Valley.  So perhaps the 109F at the Spokane Airport is a decent "middle of the road" temperature for the area.

For a bit broader view, several locations set their all-time high temperature record in the Inland Northwest on June 28th.

  • Omak: 117F, old record 114F (26 Jul 1928)
  • Wenatchee: 113F, old record 110F (18 Jul 1941)
  • Bonners Ferry: 108F, old record 105F (11 Aug 2018)
  • Chelan: 111F, old record 110F (29 Jun 2015)
  • Davenport: 107F, old record 105F (26 Jul 1928)
  • Mazama: 112F, old record 103F (1 Aug 2020)
  • Northport: 113F, old record 110F (28 Jul 1934)
  • Odessa: 115F, old record 112F (4 Aug 1961)
  • Plain: 109F, old record 104F (27 Jul 1939)
  • Priest River: 108F, old record 105F (10 Aug 2018)
  • Republic: 109F, old record 108F (2 Jul 1924)
  • Rosalia: 111F, old record 108F (27 Jul 1934)
  • Sandpoint: 106F, old record 104F (24 Jul 1994)
  • Wilbur: 110F, old record 110F (3 Jul 1922)

But not every location set all-time records.  Coeur d'Alene hit 108F for 2 consecutive days in this heat wave, but both fell short of their all-time record of 109F in 1961).  A similar story for Grand Coulee Dam.  Moscow and Pullman fell 4 degrees short of their 1961 record.  

Daytime high temperatures weren't the only records broken.  The nighttime temperatures were rather uncomfortable as well.  Spokane airport also set an all-time record for warmest low temperature.  It tied the record on the morning of the 29th, cooling only to 77F.  This equaled the record set back on 27 July 1928.  After topping out at 109F during that afternoon, the temperature was only able to cool to 78F by the morning of the 30th, setting the all-time record.

The all-time high temperature record for Washington of 118F may have been tied or even broken at a few different locations during this recent heat wave.  A climate extremes committee will review this in the coming months.


Wednesday, June 23, 2021

We are forecasting the hottest day ever in Spokane history

 A heat wave like no other is becoming increasingly likely.  Prepare NOW!


The biggest heat wave to ever strike the Inland NW on record is becoming increasingly likely.  What makes this event unique?

  • All time record high temperatures are in jeopardy for several locations
    • And this is during June (our peak heat season is late July through early August)
  • 100+ degree temps will last for several days
  • Mild overnight lows in the mid 60s to upper 70s will provide little to no relief at night
  • Occurring during a period of severe to extreme drought
  • Fire danger increasing to record levels next week and as we near the 4th of July (for this early in the season)
The Climate Prediction Center's latest Risk of Hazardous Temperatures product shows our region in a high risk of Excessive Heat through next Friday, July 2nd.  Don't be surprised by future outlooks extending this out further.


What is going to cause the excessive heat?  A very strong ridge of high pressure (record setting for late June by some model solutions).  Here is one ensemble solution showing the strong ridge centered right on top of us on Sunday.

12z GFS model of 500mb heights, winds, and temperatures valid 2 AM PDT Sunday, June 27th 2021


Strong high pressure in late June spells trouble!  Why?  The lower atmosphere continues to warm as the ridge persists over the region as the late June sun angle brings an abundance of solar radiation towards the Earth's surface which continues to warm things up each day.  Here is one model prediction of near surface temperature anomalies from this Thursday through the following week (June 24-July 3rd).  


Note the large area of warmth that persists into early July over the northwest US and southwest Canada.

So it looks like this heat wave will be around for awhile, but how hot will it get?  Our current forecast is calling for all time records to be threatened beginning Monday.

NWS Forecast High Temperature for Monday, June 28th (issued June 23rd) as compared to current all time records.

And if we don't break the all time records on Monday, we will probably have another shot on Tuesday and Wednesday!  Here is our current forecast as of June 23rd for Tuesday.

NWS Forecast High Temperature for Tuesday, June 29th (issued June 23rd) 

It is worth noting that a few models (especially the GFS) want to take the heat up another notch, suggesting temps near or above 110F for Spokane and near 120F for Moses Lake.

Spokane

Meteogram of forecast raw model temperatures for GEG (Spokane International Airport) through Wednesday, June 30th, 2021


Moses Lake
Meteogram of forecast raw model temperatures for Moses Lake through Wednesday, June 30th, 2021

While these values are not currently forecast, it does have our attention.  The record for the state of Washington and Idaho is 118 degrees at Ice Harbor Dam, WA and Orofino, ID so we will be watching for this potential closely.

What other impacts are expected?  As mentioned in a previous blog post, here, our region is currently experiencing severe to extreme drought over much of Eastern Washington into the Idaho Panhandle.  The unprecedented heat is not good news for the region.  Wheat and hay crops are already starving for soil moisture, and this upcoming heat will only make the soils drier than they currently are.


And what about fire danger?  Fuel moisture is expected to dry out considerably, reaching record low values for late June.  Fuel moisture comes in different sizes, but all are measures of how dry the grass, twigs, branches, and timber are.  

Forecast 100 hour (branch size) dead fuel moistures based off model data from the NWCC (Northwest Interagency Coordination Center) are shown below.  Red is observed, while blue is the forecast.   The bottom gray line is the minimum value on record.  The plot below is for NE Washington but the same idea applies to other areas of Central and Eastern Washington into the ID Panhandle.  As you can see the red line has dipped near the minimum value several times since mid-May (likely due to the drought).  The blue forecast line is expected to drop fuel moisture to record lows for this time of year.

100 hour fuel moisture (%) for NE Washington.  Red is observed, Blue is forecast from model data


Safety tips

So what can you do to stay safe during this heat wave?  Here are some suggestions
  • Drink plenty of fluids and wear light colored clothes
  • Check on and take care of those vulnerable to heat (children, those with chronic medical conditions, elderly, pets)
  • Stay inside during the hottest times of the day (afternoon and early evening)


Monday, June 21, 2021

Heat is On The Way!

 This week it will be hot and dry for most of the Inland Northwest and the Pacific Northwest. Seeing some of the model guidance and predicted temperatures for this week and next weekend reminded us of the June 27-28 heatwave of 2015 (you can read our blog post here). Let's dive into the comparisons of this heatwave vs 2015 and lay out the expected forecast for this week.

We talked earlier this month about our record dry spring, and in the last 30 days the story of very dry conditions continues. Many locations did receive some good rain from the thunderstorms of June 15th. But the total amount of precipitation in the Inland Northwest has been very low. For many places, around 25% of average or lower.

Here’s a look at our normal precipitation for May and June (since June isn’t complete yet, we went back into May) shown by the brown line, what we have accumulated on the green line, and compared this to 2015 since we know that year saw a hot spell in June. We can see that compared to 2015, this year (2021) is drier for the May - June period.


Taking into consideration the very dry spring and now start to summer, along comes a strong ridge of high pressure that will continue to strengthen and settle over the northwest. Below is a loop of the 500mb heights and anomaly from the GFS model, Thursday through next Monday.  For this weekend and early next week, extremely strong high pressure will dominate southwest Canada and the northwest US.

For June in eastern Washington (we’ll use Spokane International Airport as a point of reference), the normal high temperature is 74F. This week, we’re looking at temperatures 10 to 25F degrees above normal, or higher. Yes, higher. By next weekend, daytime temperatures in the 100-105F range are possible. This kind of heat hasn’t been seen since 2015, and thus why we look back to 2015 to see what kind of conditions were going on and what the models were saying then, giving us an idea of what might be to come this week and weekend.

Putting this into perspective, the record hottest temperature ever for Spokane is 108F set on Aug 4, 1961.

Going back to the comparison of 2015, June 27-28 saw temperatures of 102F (27th) and 105 (28th), with upper 90s on days leading up to and after that heat wave. The afternoon of June 28th, the 850mb temperature was 29.6C giving us that max temperature of 105F. What do the models say for our 850mb temps this week and next weekend? Below is the sounding climatology from SPC for Spokane (OTX) for 850mb temperatures. The all-time max 850mb temperature is 31.5C from early August.


Current deterministic model guidance for 850mb temperatures are quite jaw-dropping:


ECMWF:

Saturday - 28.85C

Sunday - 30.85C

Monday - 33.85C

Tuesday - 35.3C

Wednesday - 32.0C


GFS:

Saturday - 28.3C

Sunday - 29.7C

Monday - 33.2C

Tuesday - 34.5C

Wednesday - 33.3C


So all around very hot temperatures for this weekend and into early next week. Leading up to Sunday, the ridge strengthens Friday through Sunday with Sunday looking like the hottest in the next 7 days, which is as far as our forecast goes out at this time.


What about beyond Sunday? Forecast model guidance gets tricky the farther out in time, however strong high pressure patterns are ones that have a tendency to be more persistent, so confidence isn’t completely out the window with the idea that this heat could last into the middle part of next week. Ensemble guidance has also been very consistent in highlighting this strong ridge through early next week. The suite of models are showing 850mb forecast temperatures next Tuesday of 33C - 35C. We have many days between now and then, so these numbers may fluctuate a bit but this is something to keep in mind.


In 2015, we observed 4 days of maximum temperatures 100+F, and in 2020 we observed 3 days (the most is 6 days set in 1928).


The Climate Prediction Center is highlighting a high percentage of excessive heat for June 29-30, next Tuesday and Wednesday. This would suggest our ridge has lower chances of breaking down and better chances of this heat to persist into the middle part of next week.


Other factors we have to take into consideration are the overnight low temperatures. With such strong heat during the day, the overnight relief may become less of a relief. Together, this will increase our heat risk for various populations in our region. Currently, here is a snapshot of our heat risk forecast.


Our confidence is fairly high that we will see this prolonged heat last into early next week with this upcoming weekend seeing the hottest temperatures of the year, the hottest since 2015, and the hottest in the next 7 days. After that, it’s possible we will see continued hot temperatures and perhaps slightly hotter?