Friday, January 21, 2022

Is Winter Over in the Inland Northwest?

The Inland Northwest has had a rollercoaster winter so far, which isn't really that unusual.  Let's first take a look at where we've been.

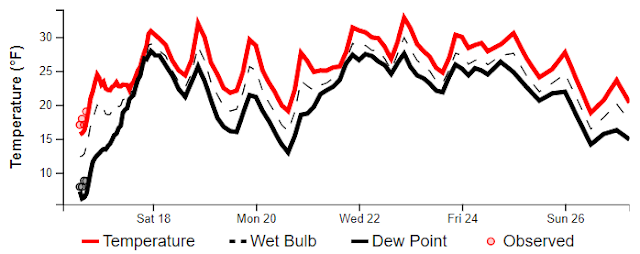
November had temperatures that were pretty close to normal for much of the month, but we did have a short warm spell in the middle of the month. (The dark blue bars are the daily high and low temperature.  The red shading shows temperatures that were warmer than normal, while light blue shading is for temperatures colder than normal.)  Then temperatures warmed as November turned to December.  Remember that record warm day of December 1st?  It hit 59F in Spokane, 64F in Lewiston, and 70F in Wenatchee!  Many locations were still waiting for their first snow of the season.


By mid-December, temperatures had settled back into more typical readings for that time of year.  Then right after Christmas, we took a plunge into the teens and single digits for about 10 days, with a fair amount of snowfall for most everyone.  Winter had definitely arrived.  The Wenatchee area received record snowfall on January 6th.

But temperatures rebounded back into the 30s by the second week of January.  What's more is that the snow stopped.  The Inland Northwest had lapsed into a stagnant, foggy pattern.

So what did this look like on the weather maps?  To answer this, we'll show you the pressure anomaly charts at 18,000 ft elevation.  Green, yellow and orange colors will indicate that the air pressure is higher than normal, which implies warmer-than-normal temperatures and drier weather.  Blue colors will indicate that the air pressure is lower than normal, indicative of colder-than-normal temperatures and stormy weather.

Here's the weather map for late November and early December.  Notice the large area of green and yellow colors over the western US.  This corresponded to dry and mild weather for the West.  Meanwhile, cool colors over the northeast US relate to cooler, wetter weather there.


For most of December, the pattern changed (see figure below).  Now the colder and stormy weather was largely up in Canada, with the vast majority of the lower 48 enjoying drier and milder weather.  The Pacific Northwest was on the cool, stormy side of things.  Notice the strong high pressure anomaly out near the Aleutian Islands (left side of the map).  This pattern is very typical for a La Nina winter, which is what we are currently in.  This forces Pacific storms to either go up over Alaska and into Canada, or storms can take a southern track near Hawaii and into the West Coast.


The 10 days after Christmas were much colder and snowier.  The weather maps for this period agree with this.  The strong high pressure is still out near the Aleutian Islands.  But the cold lower pressure is now much stronger over the western US and Canada.  Meanwhile, the weather was warmer and drier over the eastern US.  It's very common for one side of the US to be stormy while the other side is drier.


But the pattern changed in the 2nd week of January (image below).  In fact, the pattern completely flipped.  Now high pressure dominates the western US, while cold low pressure prevails over the eastern US, especially the southeastern states.  Notice that the strong high pressure near the Aleutians has completely disappeared.


So that shows how our weather pattern flipped from mild, to cold and stormy, and then back to mild and dry again.  What should we expect going forward from here?  The computer forecast models have been indicating another pattern change should take place around the end of January.

When we're looking far into the future, it's more helpful to look at a number of computer forecasts rather than just one.  The US National Weather Service has 30 computer forecasts (labeled "G" in the following charts).  The Canadians have 20 forecasts (label "C") and the European Weather Center has 50 forecasts (label "E").  If we average all 100 of these forecasts for the last 3 days of January, we get the following graph.  The color scheme is similar to what we've already been looking at.  The "warm" colors in the Pacific show that the Aleutian Island high pressure is forecast to redevelop by the end of the month.  But instead of "cool" colors over the Northwest, we see they are over the Southeast.  We haven't seen this pattern yet this winter.


But we can do more than just average the 100 forecasts.  We can run a statistical program that will group them into 4 different clusters, or potential scenarios.

Cluster 1 (upper left in the figure below) shows a very strong area of high pressure near the Aleutians, with cooler, stormier weather over the Pacific Northwest.  29 of the 100 models fell into this cluster.  But 38% of the European models agree with this cluster, and the European models tend to verify better.  If you like winter weather, this is the pattern for you.

Cluster 2 (upper right) is similar to Cluster 1, but the Aleutian high isn't as strong, and the cold/stormy weather is more in Canada and not so much in the Pacific Northwest.  Like Cluster 1, 38% of the European models agree with this idea.

Cluster 3 (lower left) is much different, with "warmer" high pressure colors extending into the western US.  50% of the Canadian models favor this cluster, while only 8% of the European models agree with this.  If dry and mild is your preferred weather, then you are hoping for this weather pattern.

Lastly, Cluster 4 has a very strong area of high pressure over all of Alaska, and cold stormy weather over the eastern US.  30% of the US models (label "G") agree with this idea, but only 16% of the European models.


So what does all this mean for our chances of precipitation?  Here's the computer forecasts of precipitation for those 4 different cluster scenarios.

Note that Clusters 1 and 2 are wetter in the Pacific Northwest, while Clusters 3 and 4 are very dry for the Northwest.  If you do the math, it's a 58% chance of being wet during this period, and a 42% chance of being dry.


Can we look even farther into the future?  Actually yes.  The computer forecasts are run out to 15 days.  So here's the pressure forecast for the first 5 days of February.  First, the US model average.  This pattern should be familiar.  It looks rather similar to the pattern we saw just after Christmas, when things were cold and snowy in the Pacific NW.  The strong high pressure near the Aleutians should be around for this period, with colder lower pressure over the Northwest US.


Here's the Canadian model average for that same time.  It's surprisingly similar to the US model average.  


In fact, the European model average for the first 5 days of February (not shown) also looks very similar.  This kind of agreement between the models doesn't often occur.  Does it mean it's a sure bet?  No, but confidence is increasing since they agree with each other and they've been forecasting this for the past few days.

So to summarize, we're looking at a week of dry weather over the Pacific Northwest.  During the last 3 days of January, the pattern will start to change.  But there's a lot of disagreement on what the pattern will be during this transition period.  We could be cold and stormy, or continued mild and dry.  But by the first week of February, the odds favor a colder and stormy  weather pattern.  This could be similar to what we saw during the 10 days after Christmas, but probably not as cold.  

Updated 21 Jan 2pm

The NWS Climate Prediction Center just issued their Week 2 Hazard Outlook.  They are now specifically noting a moderate risk of much below normal temperatures for the Inland Northwest as well as northwest Montana starting on the 2nd of February.


They also see a slight risk of much above normal snowfall for the Cascades and Idaho Panhandle for 30 Jan - 4 Feb.


Both of CPC's outlooks agree with our analysis in this blog.  So confidence is increasing for the potential of a return to a colder, snowier pattern for our area.


Wednesday, January 5, 2022

Wenatchee, Leavenworth to get buried in snow!

The biggest snow event so far this winter is coming for most areas of the Inland NW.  This is especially true if you live in the Cascades including Wenatchee, Leavenworth, Lake Wenatchee which this blog will focus on.  Your unattended car in the Cascades could look like this come Thursday with feet of snow in the forecast.  


Be prepared for road closures and power outages in Chelan county!

First what is going to cause the snow?  Typically we need two things, cold + precipitation.  We have the cold as illustrated by temperatures at 10 am this morning.

Observed surface temperatures 10 am PST January 5th, 2022

Temperatures were especially cold in the Cascade valleys with just 4F in Winthrop and 19F in Wenatchee.  Next we need a significant source of moisture

GFS model forecast of Water Vapor Transport valid 4 PM PST Thursday, January 6th, 2022

This plot shows the transport of high water vapor (moisture) content towards the area as noted by the orange colors.  The moisture plume looks to be directed right at Chelan county, which will be hit with EXTREME SNOW TOTALS!  If you live anywhere in Chelan county, or the Wenatchee area, this afternoon is the time to prepare!  

How much snow are we talking?  Here is the NWS forecast as of Wednesday morning.

These are very impressive snow amounts for Chelan county with a foot for Wenatchee,  2 feet for Leavenworth/Plain areas, and 4 feet for Stevens Pass!  Another hard hit area is the Idaho Panhandle with around a foot in the valleys, and 2-3 feet in the mountains.  For the latest forecast for your city, head to www.weather.gov/spokane

One important factor with the snow will be the water content as heavy wet snow can weigh down trees and power lines leading to damage from broken tree limbs and power outages.  This looks like a major threat for Chelan county!

Here are couple model depictions courtesy College of Dupage showing as much as 7" of liquid equivalent precipitation for the Cascade crest around Stevens Pass, with significant amounts spilling into Lake Wenatchee and Leavenworth.

GFS forecast of total precipitation (inches) 4 AM Jan 5- 4 AM Jan 8th, 2022

NAM forecast of total precipitation (inches) 4 AM Jan 5- 4 AM Jan 8th, 2022

How confident are we in the heavy snow forecast in the Cascades?  The University of Washington has recently developed high resolution modeling where a forecast can be run several times tweaking the initial state of the atmosphere for each forecast, which can give forecasters better information with uncertainty when looking at multiple forecasts as well as different models (also called ensemble forecasting).  

The black line is the average of all models.  

Let's begin with Stevens Pass (most solutions have 3-4 feet)

00z/Jan 5th Stevens Pass accumulative snow accumulation forecast from UW Ensemble Forecast

Leavenworth (most solutions 20-25")

00z/Jan 5th Leavenworth accumulative snow accumulation forecast from UW Ensemble Forecast


Wenatchee (most solutions show over a foot)
00z/Jan 5th Wenatchee accumulative snow accumulation forecast from UW Ensemble Forecast

This particular modeling system is going for quite a bit more snow in Wenatchee compared to other modeling systems, and something we are monitoring.

Significant amounts of snow are also forecast for the Methow Valley

Winthrop

00z/Jan 5th Winthrop accumulative snow accumulation forecast from UW Ensemble Forecast

How could these totals compare to historic snow events?  This will span over a two day period so we looked at max 2 day snow totals on record for Plain, WA (near Lake Wenatchee), and Wenatchee, WA

Plain, WA Top 2 day snow events

Wenatchee, WA top 2 day snow events

This event could make the top snow event list!  One last thing, snow may mix with freezing rain during the event which could make things even more treacherous!

In summary...

  • Challenging travel is expected region wide by Thursday morning
  • Travel could be extremely challenging in the Cascades and over Lookout Pass with feet of snow in the forecast.  
  • Be prepared for power outages and road closures in Chelan county as the snow moves in beginning this evening (Wednesday), and intensifies overnight into Thursday.


Thursday, December 23, 2021

Snow then Bitterly Cold

By now, many have probably heard of the much colder temperatures arriving for next week.   These may be some of the coldest temperatures the region has experienced in at least the past 10 years.  If you haven't already, now is the time to prepare!


Before we get into the details of the bitter cold, let's briefly talk about the weather pattern going into Christmas weekend which is expected to bring snow to much of the region.

A very cold weather system will stall over the region from Friday through Monday, as shown by the dark blue colors from this model simulation showing anomalous low pressure over the region.

18z Dec 23rd GEFS forecast of 500mb heights and anomaly (shaded) valid Dec 24-27th, 2021

The cold system will result in a very unstable atmosphere, with bands of moderate to heavy snow showers each day.  Pinpointing where these set up is often difficult to predict, but can produce localized areas of heavy snow accumulations.  Right now models are showing the heaviest snow amounts over far NE Washington into the Idaho Panhandle.

But the big story continues to be the bitterly cold for next week.  

The same model as above shows the really cold stuff settling in on Monday with the coldest days likely Tuesday and Wednesday (as noted by the bright purple shading), with gradual "warming" later in the week but still temperatures well below normal.

18z Dec 23rd GEFS forecast of 2 meter temperature anomaly (shaded) valid Dec 27, 2021 - Jan 1, 2022


So how cold are we talking?  Well if your thrown in all of the computer models together (about 100 of them), and take the median forecast, this is what it shows for the forecast low temperature on Wednesday, Dec 29th.

National Blend of Models (NBM) forecast of low temperature Dec 29th, 2021

Wow!  Some locations colder than -10F!  It is worth noting low temperatures can be tricky to forecast when it comes to extreme cold as temperature drops are very dependent on winds becoming light and clearing of the skies.  But this is the median of many model forecasts, so it's possible it could be even colder, or warmer than the numbers shown above.

You may ask when was the last time Spokane dropped all the way down to -10F or colder.  Well it's been awhile, but certainly can happen.  

It hasn't happened since the 2010-11 winter, where there were 3 instances of the bitterly cold nights.

And what about high temperature? 

National Blend of Models (NBM) forecast of high temperature Dec 29th, 2021

Many areas possibly not getting out of the single digits according to this model blend forecast!

With areas of moderate to heavy snow through Christmas weekend, and bitterly cold temperatures next week, be sure to keep up to date with the latest forecasts, advisories, and warnings at www.weather.gov/spokane


Tuesday, December 21, 2021

Looks Very Cold Next Week

 You may have already heard that cold weather is a possibility for next week, the last week of 2021.  While some may say "it's supposed to be cold in winter", it is still worth taking a look at some numbers and charts to see what is possible and how it compares historically.  In our area, the coldest day of the year on average is the last week in December.

First, let's start by saying that we're looking more than 7 days into the future.  Computer forecasts that far out do have some skill (i.e. better than a coin flip), but they are by no means a slam dunk.  The Climate Prediction Center issued this outlook on Monday (20 Dec).  They have high confidence of Much Below Normal Temperatures next week for Washington to the Dakotas.  The category of "High Confidence" isn't used a lot for an outlook that far out, so this is worth paying attention to.


The reason for their confidence lies in the fact that the major weather modeling systems generally all agree on this pattern.  Here's the temperature forecasts for 850mb (about 4000' elevation) from these models.  First, the European model valid Thursday afternoon (Dec 30th).  You don't need to be an expert to figure out this chart.


Here's the same figure from the U.S. model, but for two days earlier (Tuesday afternoon 28 Dec).  Looks very similar to the European models, but just earlier in the week.


Lastly, here's the Canadian model forecast for Wednesday 29 Dec.  You can see that this model pushes more of the cold air into Montana and less of it into the Inland Northwest, which is what usually happens.  But even this forecast would still mean cold weather for our area.


How cold could it get?  Forecasting cold temperatures is MUCH more difficult than hot temperatures.  The main reason for this is that cold temperatures rely on a careful combination of several factors (snow on the ground, clear skies, light winds, dry air, etc.).  So a lot could change in the forecast.  But we can run some probabilistic numbers to see where things could go.

If you throw all of the computer models together (there's about 100 of them) and take the median forecast, here's what you get for the forecast high temperature for next Thursday (30 December).


A high of only 9 degrees in Spokane doesn't happen all that often.  When was the last time you may ask?  Believe it or not, it was on November 24th of 2010 (pretty early in the winter for that kind of cold).  Spokane had a low of -10F and a high of only 9F, with 5" of snow on the ground.  

Here's a chart showing the coldest daytime temperature at Spokane Airport each winter since 1947.  While just about every winter has days that don't warm above 20F, staying below 10F during the day isn't all that common.


The map of high temperatures above was the median of all of the models.  Statistically, that means that half of those 100 models actually think it will be colder than that image.  Conversely, the other half of the models think that things will be warmer, with about 10% of the forecasts winding up with a high in the mid 20s.

As we started off this blog entry, there's a long time between now and next week, and the forecast could still change considerably.  There are still some model scenarios that keep much of the cold air to our east, but they are the minority.

One important note about the upcoming potential cold snap.  It does not appear that this point that there will be a lot of wind with the cold.  So wind chill doesn't appear to be as much of a threat.  But again, this could change in the coming days.  


Friday, December 17, 2021

Why was Thursday's snowstorm such an icy mess for commuters?


For anyone driving on the roads in the Spokane/Coeur d'Alene metro area on Thursday (16 Dec 2021), the roads were rather icy in spots.  The Spokesman-Review published a few pictures online.  More than 100 accidents were reported by Spokane Police Department, leading them to urge people to stay home if possible.  


An Ice covered Grand Boulevard created the conditions for this multi-car pileup that also included a STA bus that slide into a power pole in the southbound lanes below 12th Ave, Thursday, Dec. 16, 2021. No one was injured, but southbound Grand was shutdown until tows could be arranged and the road de-iced by the city.

Colin Mulvany The Spokesman-Review


The snowfall amounts from this event weren't particularly noteworthy.  Here's a map of snowfall reports from the CoCoRaHS website.  In the Spokane area, 1 to 3 inches of snow fell.  Over in the Idaho Panhandle, snowfall was much more varied, with a few reports of 5 to 6 inches, but most folks in the Coeur d'Alene area received 3 to 5 inches.  In other words, this was a fairly typical snowfall event for our area.


Additionally, the temperatures were rather cold, and the snow was dry.  The kind of snow that is difficult to make into snowballs.  And that kind of snow usually doesn't cause icy roads.  So what caused yesterday's treacherous icy driving conditions?

To answer that question, we need to look at the road pavement itself.  Or more specifically, the temperature of the pavement.  Thankfully, in recent years the Departments of Transportation (Washington State DOT, Idaho Transportation Department) have installed pavement sensors at various locations.  These sensors measure not only the temperature of the pavement, but they can also sense whether there is moisture on the pavement, and if it's in the form of liquid or ice.

You can see one of these sensors in the pavement on the Highway 395 camera near Loon Lake.


Here's a graph of the temperatures on I-90 at the Perry Curves.  Note that the temperature was around 29F during the night, but then it warmed to 34F shortly after 9am.


According to the weather observation at nearby Felts Field, light snow started to fall just before 10am, and continued until 4pm, with air temperatures of 31F or 32F.  So as that morning snow began to fall on the road pavement, the 34 degree pavement was able to melt some or all of the snow, resulting in wet or slushy pavement on well-traveled roads.  But note that the pavement temperatures began too fall just after noon, which is typical for pavement temperature.  The pavement cooled below freezing around 230pm, and all of the moisture that was on the roads quickly froze, causing the icy conditions that snarled traffic.

Looking at the sensor at I-90 and Liberty Lake, we see a little different situation.  At that location, the road temperature was around 28F at sunrise, but only warmed to 31F during the morning, and then quickly cooled back to 30F during most of the snowfall event.  This cooling occurred right after the snow started.  In other words, the pavement remained below freezing for the entire snowfall event, so it's likely that there was little or no melting of the snow, and conditions at this location probably weren't as icy as other parts of the metro area.


So the icy roads on Thursday took a careful combination of several factors. The air temperatures were cold and stayed below freezing.  The mid-morning timing of the snow allowed some of the roads to warm above freezing, which melted and then refroze later in the afternoon.  Locations either north or south of the Spokane metro area either had the snow start too early to allow pavement melting, or started too late to melt and refreeze.  Had the snow in Spokane started a few hours earlier, the outcome would likely have been much different than what we experienced.


White Christmas for 2021?

It is that time of the year when many residents of the Inland Northwest are asking "Will we have a White Christmas this year?"  In this blog we will dig into the details, and try and answer this important question.

We must first begin with what our climate has to say about the chances.  NCEI recently released an updated map based off 1991-2020 data.  This is the odds of a White Christmas based simply off historic odds.


On average, areas near the Cascades, northern WA, and the Idaho Panhandle have a White Christmas.  Spokane odds are close to 50%, while the odds drop off further as you head south into the Tri-Cities area and Lewiston area.

But what about this year?  For it to officially be declared a White Christmas, the snow depth on the ground needs to be 1" or greater.  So let's begin with what is on the ground now from our dedicated CoCoRaHS observers.

Snow depth reported from CoCoRaHS observers on Dec 17th, 2021

According to the map snow is covering the ground over many areas that already have good chances for a White Christmas.  

So what does the weather look like as head into Christmas Day?  An active weather pattern as a strong blocking upper ridge sets up near the Aleutian Islands and a deep trough over western North America and the northwest US.

12z/Dec 17th GEFS 500mb heights and anomalies (shaded) valid Dec 18-25th, 2021

Multiple weather systems moving through the region will produce precipitation.  Here is what the model shows for total precipitation through December 25th.

12z/Dec 17th GEFS total precipitation (inches) from Dec 17-25th, 2021

Note that one of the wettest area through Christmas Day over the United States is over Washington, North Idaho, Oregon, and California.

But this is just precipitation.  Since the pattern looks wet, the real question about White Christmas chances this year will come down to temperature.  Will precipitation fall as rain, snow, or a mixed bag?  Let's look at the temperature anomalies through the period beginning Saturday.

12z/Dec 17th GEFS forecast of 2 meter temperature anomaly (degrees C) from Dec 18-25th, 2021

Note that as we go into next week, there is a growing area of cold air over Canada, but it looks like much of this arctic air will stay north of our area (at least through Christmas).  For our region there are some warmer temperatures over southern WA into the Lewiston area on Saturday, but these diminish with no strong anomalies next week (close to normal temps for late December).

But an anomaly doesn't tell us much about if precipitation will fall as rain or snow.  For example for some of our colder spots (Methow Valley), warmer than normal temperatures will still lead to snow most of the time in late December.  So let's dig a little deeper.

Here we will show an ensemble system (National Blend of Models) which shows forecast temperatures for several cities through next week.  This method has proven to be more skillful than using just one model forecast.  The red line is temperature. Also note these temperature forecasts are the average from a variety of weather models and ensemble systems, and don't reflect uncertainty in the numbers which tends to increase with time, especially in the day 5 and beyond time frame.  

We will work our way from north to south.  Let's begin with Sandpoint and Omak.

Sandpoint


Omak

With many areas already having snow on the ground, and a high likelihood for more, White Christmas chances are looking good.

Now let's move south, looking at Wenatchee, Moses Lake, and Spokane Valley.

Wenatchee 

For Wenatchee, temperatures near or below freezing and more snow opportunities the odds are looking good for a White Christmas as well.

Moses Lake

Spokane (Felts Fields Forecast)

This is a tougher call for these two locations.  Rapid warmup into Saturday, then temperature hovering around the freezing mark through Christmas.  This suggest a mix of rain and snow may fall through the period.  But with several opportunities for precipitation and temperatures cold enough for snow most of the time, odds are looking favorable for a White Christmas.

Let's go further south and take a look at Pullman and Lewiston.

Pullman


After a period of above freezing temperatures on Saturday, it looks like temperatures will hover near or below freezing through much of next week.  White Christmas chances are looking high.

Now one of the trickier spots, Lewiston.

Lewiston

As you can see, temperatures are forecast to be near or above freezing for much of next week, so there is more uncertainty of a White Christmas.

In summary, odds of a White Christmas are looking higher than historical odds this year.  Most areas should have a White Christmas, with the Lewiston area having the highest uncertainty.