Friday, December 11, 2015

Wet December - Will it continue?

December has been off to a WET start!  Some may be wondering if this will continue through the month.  We will address some of the impressive numbers so far this month and also take a peak into the future.

So, how wet has it been?  Here is a map showing total precipitation from December 1st through the 10th for selected areas.


Quite the impressive precipitation totals especially in the Cascades.  Some locations on the west slopes of the Cascades have received amounts in excess of 10 inches.  It's also been wet in the Idaho Panhandle with Mullan Pass coming in with 6.70 inches, and 5.38 inches in Prichard.  

So how do some of these totals compare to normal?  Well these amounts only cover ten days, so its no surprise that these totals are well above normal.  Take a look at the values below.


So what has caused this abnormally wet period.  The answer is a very strong and active jet stream that stretched across the entire Pacific Ocean which brought numerous storms into the area.  


NCEP reanalysis of 300mb zonal mean wind Dec 1st through Dec 8th, 2015

So what does the future hold in store?  More active weather is in store with the parade of storms persisting.  Let's begin with Saturday...


     18z/11th GFS forecast of 500mb height and 700-500mb Relative Humidity
4 PM Saturday

The bright screen shading on the map is indicative of high moisture content in the atmosphere.  A deep low pressure system is located near Vancouver Island.  This storm is expected to bring snow to the Cascades and northern valleys and mountains.  Locations from Interstate 90 south from Ellensburg to Lookout Pass are expected to see mostly rain in the valleys with snow in the mountains.

So how about Sunday?  

18z/11th GFS forecast of 500mb height and 700-500mb RH 10 AM Sunday
You can see the wet weather continues with the best focus of moisture (with valley rain and mountain snow) over Oregon, Southeast Washington, and Idaho. This day could bring significant snow to the Blue Mountains, Camas Prairie, and Lookout Pass areas.

After this the pattern turns cooler and drier with a potential weak system Tuesday night bringing light snow to the Idaho Panhandle.  But after that models show potential another wet storm on or around Thursday.  

18z/11th GFS forecast of 500mb height and 700-500mb RH 4 PM Thursday
It's too far out to have much confidence in the specifics for this storm, but more rain and snow looks like a good bet.  Beyond this forecast confidence drops, but long range outlooks from the Climate Prediction Center for Dec 19th through Christmas day are favoring elevated chances of wetter and cooler than normal conditions.  

Overall it looks like December is going to finish out much wetter than normal.

Tuesday, December 8, 2015

Another Wind Storm? Not a repeat of 17 November.

Yes, there is another wind storm heading for the Inland Northwest.  But it will NOT be as strong as the 17 November wind storm.  While this event is similar to the storm last month, there are differences.  Let's see in what way.  First, take a look at our blog that we put out before that wind storm.  It's at:

http://inlandnorthwestweather.blogspot.com/2015/11/widespread-damaging-wind-storm-tuesday.html

You'll see that we talked about 2 main weather patterns for strong winds.  The November 17 storm was a pattern #2.  Tomorrow's storm will be more of a hybrid between pattern #1 and #2, which is much more common.  In other words, tomorrow's wind storm will be more like what we are used to getting.

For the November wind storm, the surface low that passed by over southern BC was 985mb when it was to our north, and then 977mb in the lee of the Rockies over Alberta.  Below are the surface pressure forecasts for tomorrow's storm.

GFS forecast of Sea Level Pressure for 830am 9 Dec 2015

GFS forecast of Sea Level Pressure for 200 pm 9 Dec 2015
This time around, the low will be about 991 mb over southern BC, and 985 mb in Alberta.  That's about 6-8mb weaker than the 17 November storm.  Also note that the track is slightly south of the storm last month.  This would suggest that the stronger winds will also be shifted farther south than last month.  That's good news for the northern counties (i.e. Bonner, Boundary, Pend Oreille, Stevens), but may be bad news for the southern counties like Whitman, Latah, Nez Perce, Asotin, Garfield, and Lewis.

Also, the jet stream is displaced farther south, over Oregon instead of Washington.  All of this points to a weaker system than November, but still a respectable event that could cause some damage.

Here's the forecast of peak winds:


Comparing this forecast to the previous month, you'll notice that wind speeds are overall weaker by about 10 mph.  The exception to this is in the southeast (Pullman, Lewiston, Winchester), where the forecast is about 10 mph stronger.  So the focus for potential damage will be in those areas.

There is one fly-in-the-ointment to all of this, that wasn't a factor in November.  There is the potential for thunderstorms on Wednesday.  (Yes, this is mid-December.)  We have a VERY moist air mass in place, and the cold front on Wednesday is strong.  This combination could lead to a few thunderstorms.  They won't be "severe".  But, a thunderstorm can bring down stronger winds from the upper levels of the atmosphere.  So any thunderstorms that do form will have to be watched closely.

After the wind on Wednesday, the weather pattern will change to cooler with a better chance for snow in the lower elevations. 


Monday, November 30, 2015

What's a typical El Nino?

So by now you've probably heard that a strong El Nino episode is underway and will continue through this winter.  We wrote about it earlier this fall:


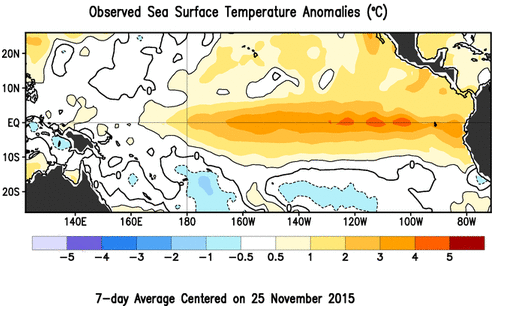
Since we wrote up that blog, not much has changed.  El Nino continues to be strong.  Here's the sea surface temperature anomaly for the past week.  This is a classic El Nino signature.


El Nino typically means milder winters in the Pac NW.  But after our really mild winter last year, does that mean that this winter will be even milder?  In other words, what is a typical El Nino winter like?  Let's take a look at some of the recent moderate and strong El Nino winters to see if we can answer that.

2009-10

This was the most recent El Nino winter, and was technically a moderate El Nino, not in the strong category like this winter.  But it's still worth a look.  Here's some notes from that winter.
  • A cold snap in early December dropped daytime temperatures into the teens and sub-zero at night.  The month was colder than normal, but the month was rather dry so there wasn't much snow either.
  • January was just the opposite.  All but a few days were warmer than normal with very little snow.
  • February continued the mild trend, but precipitation was near normal.
2002-03

This too was a moderate El Nino.
  • December was mild and wet, with rain or snow on just about every day.  Temperatures turned a little colder after Christmas resulting in a few inches of low-elevation snow.
  • January was also mild and wet.  Very few days remained below freezing during the day.  And precipitation was twice the normal amount.  There were a couple of snowy days.
  • February was mild but dry, with little in the way of snow.
1997-98

This is the most recent strong El Nino.  So how did it compare to other winters?
  • December temperatures were about normal, but it was rather dry.  As a result, there were only  a handful of snow days.  3.4" fell in Spokane one day, but Moscow had 6" just after Christmas.
  • January was similar to December.  There was a cold snap in the middle of the month with a couple of sub-zero nights.  But most days of the month were in the 30s and 40s.  Spokane had about 7 snow "events", each of which amounted to less than 2 inches.  Wenatchee Airport had a 13" snow storm in the middle of the month.
  • February was more like spring than winter, with day time temperatures in the 40s and 50s, and quite a bit of rain.
1991-92

Another strong El Nino.
  • December got the winter off to a mild start.  Nearly every day warmed above the freezing mark.  As a result, there were only a couple of snow days.
  • Temperatures in January were closer to normal with about 6 snow days.
  • Aside from a 2-day cool snap, February was very mild and snow free.
1982-83

This strong El Nino is really the first winter when the "El Nino" phrase was used in the general public.
  • Winter started early with a couple of cold snaps in November.
  • December was typical for the last month of the year.  A significant snow storm early in the month was followed by a short cold spell.  More snow fell in the middle of the month, and then just before Christmas.
  • After a cold snowy start to January, mild weather arrived on the 4th and remained for pretty much the rest of the month.
  • The mild weather continued in February, although there were a couple of cold snowy days in the middle of the month.
We could go on, but you probably get the basic idea.  El Nino brings milder winters to the Inland Northwest.  But there will still be some wintry days, just not as many as normal.

So using the past El Nino winters as an indicator, here's what we can most likely expect this winter:
  • December
    • Temperatures will probably be normal or just a tad warmer than normal.  But it will probably be the coldest month of the winter.  Might have a cold episode or two with near zero temperatures at night.
    • Expect 3-5 days of snow, but most of these will probably be 1-3".  Might see a one day snow storm with more than 3".
  • January
    • Temperatures will be warmer than December.  Sub-freezing day time readings will be rare.
    • Might see 2-3 days of snow, probably about 1" each.
  • February
    • Expect an early spring.  Daytime temperatures will be in the 40s and 50s.
    • Snow in the lower elevations will be rare.
Remember, last winter had very little snow for the lower elevations.  A "normal" El Nino winter will likely have more snow than last winter, but less than a typical winter.  So the odds are you'll use your snow shovel/blower more than last winter, but not as much as "usual".  

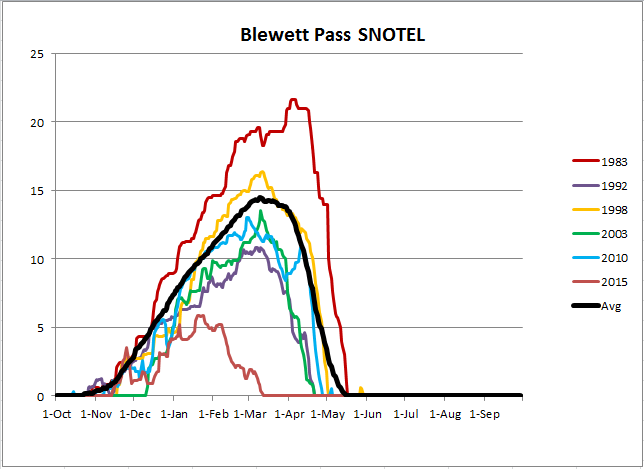
So what is an El Nino winter like in the mountains?  Let's take a look at two locations.  Bear Mountain in the northern Idaho Panhandle, and Blewett Pass in the Cascades.  Here's the graph of Snow Water Equivalent (SWE) for those 2 sites.  SWE measures the total amount of water in the snow pack.

Snow Water Equivalent at Blewett Pass for various years as well as the Average (black line)


Snow Water Equivalent at Bear Mountain for various years as well as the Average (black line).  Data for Feb-Apr was missing.
There's a few points to make from these 2 graphs.
  • The 1982/83 Strong El Nino actually had an above-normal snow pack in the mountains.
  • The other El Nino winters had normal to somewhat below-normal snow pack for the mountains.  
  • The below-normal snow pack years were still at least 75% of a normal snow pack.
  • The snow pack from these El Nino winters melted off sooner than normal, typically by 2-5 weeks.
  • All of the El Nino winters had a lot more snow than last winter.
The last of these points is perhaps the most important.  The mountain snow pack last year was the lowest ever observed, and melted off sooner than any other winter.  Could the upcoming winter see the same?  It's possible, but the odds are that we'll see a mountain snow pack that's at least 75% of normal.


Monday, November 16, 2015

Widespread Damaging Wind Storm Tuesday

In the Inland Northwest, we get several windy storms every winter.  It comes with the territory of living at this latitude, as well as being a frequent "gateway" for storms to enter the US.  But many of these windy storms aren't considered "extreme".  A typical wind storm in our area will result in gusts somewhere in the 50-60 mph.  A wind gust over 60 mph becomes much more rare.  The table below shows the wind records for the Spokane Airport.

Spokane Airport Wind Record (by month)
 
Fastest Mile (1949-1995)
Peak Gust (pre-1984)
Peak Gust (since 1984)
January
59 MPH (Jan 9, 1972) 
67 (Jan 9, 1972)
56 MPH (Jan 11, 2014)
February
54 MPH (1949)
58 MPH (Feb 28, 2011)
March
54 MPH (Mar 16, 1971) 
64 (Mar 26, 1971)
66 MPH (Mar 15, 2009)
April
52 MPH (Apr 17, 1987)

62 MPH (Apr 17, 1987)
May
49 MPH (1957)
59 MPH (May 3, 2010)
June
44 MPH (1986)
77 MPH (Jun 21, 2005)
July
43 MPH (1970)
67 MPH (Jul 23, 2014)
August
50 MPH (1982)
54 (Aug 9, 1982)
54 MPH (Aug 25, 2013)
September
38 MPH (1999)
55 MPH (Sep 6, 2009)
October
56 MPH (Oct 27, 1950)
65 (Oct 27, 1950)
62 MPH (Oct 16, 1991)
November
54 MPH (Nov 27, 1949)
65 (Nov 27, 1949)
64 MPH (Nov 16, 2010)
December
51 MPH (1956)
63 MPH (Dec 12, 1995)

The all-time wind speed at Spokane is 77mph, but that was caused by a thunderstorm gust front, not a widespread winter storm.  So ignoring that, a really strong winter storm will typically gust into the 60-65 mph range.  The highest non-thunderstorm wind at Spokane is 67 mph from January 1972.

The storm on Tuesday will have the potential to do that.  Here's some of the damage reported by the Spokesman Review in  January 1972:

  • Communities of Beverly, Shawana, and Mattawa (along the Columbia River south of Wenatchee) sustained extensive damage.  Six trailer houses were overturned and destroyed.  Other low-income homes were leveled.  All three towns were without power and phones.
  • Rattlesnake Mountain near Richland measured a wind gust of 150 mph, the top speed of the instrument.
  • Gusts of 60-65 mph and higher were prevalent.
  • The wind blew away the upper mechanical room of the University of Idaho Physical Science Building in Moscow.
  • Wind toppled chimneys in Colfax.

Another strong wind storm occurred on Nov 19, 2003.  Here's some reports from that storm:

  •  In the northern Idaho panhandle a dozen large pine trees fell on summer homes along Lake Pend Oreille. 
  • In the Coeur d'Alene area numerous trees fell on houses and power lines.
  • At Pomeroy a wind gust was measured at 65 mph. 
  • Over the Palouse region a wind gust blew the roof off of a barn near Colfax. 
  • Near Newport a tree was blown onto a house. 
  • The heaviest damage occurred in the Spokane area where numerous trees were toppled onto houses and power lines. Up to 16,000 people were without power in Spokane's South Hill neighborhood. 
  • Fairchild Air Force base recorded a wind gust of 68 mph which ripped the roof off of a recreation center. 
  • At Spokane International Airport a wind gust of 63 mph was recorded and at the Spokane National Weather Service office the wind gusted to 61 mph. 

There are two predominate weather patterns for high winds in the Inland Northwest.

Weather patterns for high winds in the Inland Northwest

The first pattern is where a deep low approaches the Washington/Oregon coast from the south or southwest.  This pattern is fairly common, and most storms produce high winds along the coast.  The stronger storms also deliver high winds to the inland areas of western Oregon/Washington (i.e. I-5 corridor).  But strong winds east of the Cascades in this pattern are rather rare.  Only the strongest storms of this pattern can produce damaging winds in eastern Washington.  Some of these are the Columbus Day storm of 1962, December 10th 1995, and the Hanukkah Eve storm of 2007.

Track #2 is more rare, but is the more favored pattern for high winds in eastern Washington and north Idaho.  The low tracks west-to-east across southern British Columbia.  If the low is strengthening as it does this, then high winds are more likely.

Here's what the forecast for Tuesday looks like:

GFS MSLP forecast valid 7am Tue 17 Nov 2015

GFS MSLP forecast valid noon Tue 17 Nov 2015

GFS MSLP forecast valid 6pm Tue 17 Nov 2015


The low follows Track #2 across southern BC.  The central pressure starts at 993 mb off the BC coast, and deepens to a 977 mb over Alberta.  In other words, this is a classic set up for high winds in the Inland Northwest.  

So how strong will the winds be?  Here's the current forecast:


You'll notice that the 68 mph forecast for Spokane is higher than the January 1972 storm.  We don't have the skill to predict the winds to the nearest mile-per-hour.  But we do think that this storm has the potential to rank as one of the strongest ever in the Inland Northwest. The areas in the mountainous regions have lower wind speeds forecast, but don't let that fool you.  There's a lot more trees in those locations, so there's more trees to blow over.

Be prepared for lots of downed trees, power lines, fence and roof damage, and maybe even some blowing dust in the Columbia Basin.


Tuesday, November 3, 2015

Halloween Weekend Atmospheric River Event

Over the Halloween weekend, an atmospheric river brought widespread precipitation and wind to the Inland Northwest. Here are some of the highlights from the weekend.

Friday October 30
    • 50 mph Wind Gust across the Columbia Basin and Palouse region creating blowing bust and closing down a portion of I-90.
      • Ephrata - 55 mph
      • Mission Ridge - 92 mph


    • Record high temperatures at several locations.
      • Ephrata - 74F
      • Wenatachee - 73F
      • Moses Lake - 73F
      • Grand Coulee - 67F
    • Thunderstorms developed over the central Panhandle Mountains.
    • An inch of rain fell in the higher terrain with around 2 tenths of an inch in the Columbia Basin.
24-hour Precipitation ending 5am Saturday 31 Oct


Saturday Oct 31
    • Thunderstorms over the Palouse.
Radar image Saturday afternoon

    • First snowfall of the season above 5000 feet.

    • Areas along the east side of the Cascades like Leavenworth, Plain, and Winthrop received over one inch of rain.
    • Areas along the Cascades crest received 4+ inches of rain
    • In the Idaho Panhandle and extreme Eastern Washington, areas received around a half to three quarters of an inch of rain. 
24-hour Precipitation ending 4am Sunday 1 Nov
    • Stehekin River (Chelan County) and Paradise Creek (Moscow, ID) rise rapidly


Sunday Nov 1
    • The moisture associated with the atmospheric river begins to dip South and exit the region.
    • The Idaho Panhandle received the most rain with most locations getting a quarter to half an inch of rain
24-hour Precipitation ending 4am Monday 2 Nov

    • The Cascades and Northern Mountains experienced a drop temperatures and began to receive snow Sunday.


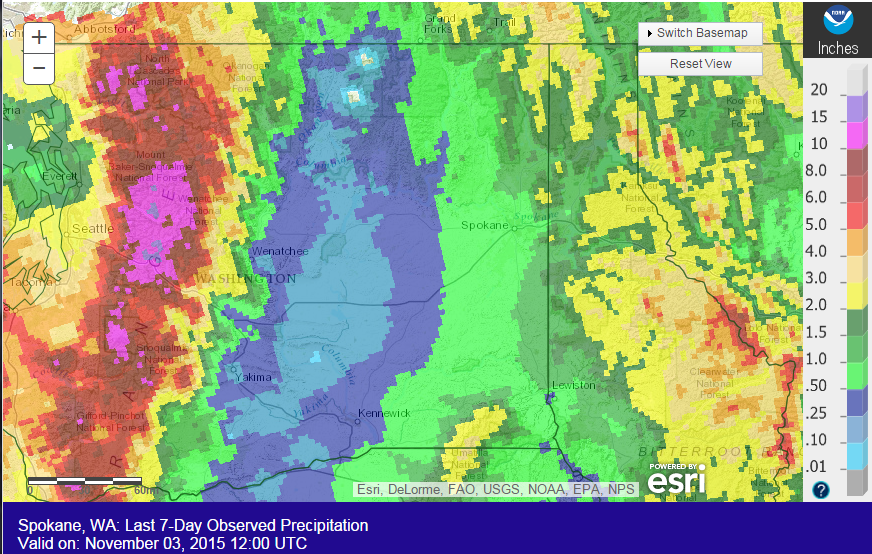
The total precipitation for the weekend was impressive, as expected.  Some parts of the western Cascades picked up over 10" of moisture, while the Panhandle mountains generally received 3-5" of rainfall.
7-day Precipitation ending 4am Tuesday 3 Nov

Here's some weekend totals from the local area

Spokane: 0.61"
Coeur d'Alene: 0.88"
Lewiston: 0.43"
Wenatchee; 0.08"
Omak: 0.15"
Ephrata: 0.03"
Moses Lake: 0.08"
Pullman: 1.08"
Deer Park: 0.92"
Republic: 0.48"
Bonners Ferry: 1.13"


Wednesday, October 28, 2015

The start of the Wet Season

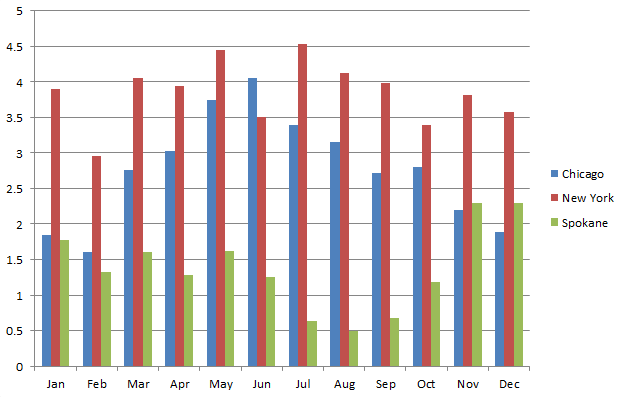
The bar graph below shows the average precipitation for Chicago, New York, and Spokane.


Much of the U.S has the majority of their precipitation in the summer (Chicago), or it's fairly evenly distributed throughout the year (New York).  In the West, it's the other way around. We have a distinct dry season in the summer, and wet season in the winter. 

After the hot dry summer, Pacific storms in September and October typically become more frequent, and increasingly wet.  And then in November, the storm door really opens; it's twice as wet as October.  In fact, for most of the Inland Northwest, November is the wettest month, followed closely by December and January.  (The exception to this is Lewiston, which has it's wettest month in May).  

This year, the storm door looks like it will open rather suddenly.  The storms for October have been fairly weak and temperatures have been near record warmth.  But all of that will change this weekend.  Below is the forecast rainfall for the next 5 days from 2 forecast models, the GFS and Canadian.


GFS Predicted Precipitation Oct 29 - Nov 2 2015


Canadian predicted precipitation 29 Oct - 2 Nov 2015


Now, before you go thinking that Wenatchee is going to get 0.5" to 1" of rain, or Spokane is going to 2" of rain, these models are notorious for spreading the rain too far away from the mountains into the lower elevations.  They know that the Mountains exist, but they don't have enough resolution to account for just how sharp the rain shadow is.  

The weather pattern that's going to bring us all this rain is a strong jet stream from west to east.  That kind of pattern produces a large rain shadow east of the Cascades, that extends at times all the way to Coeur d'Alene.  So for the area from Wenatchee to Spokane to Lewiston, take those computer forecasts and cut them in half, and you're probably in the ball park of what will happen.  For the Cascades and Panhandle mountains, the computer forecasts are probably a bit too low.  In other words, the western Cascades could see a foot of rain by Monday morning, and the Panhandle Mountains could see 6" or so.  That's a really nice start to the wet season.

This weather pattern is also a windy one.  Here's the wind gust forecast for Saturday afternoon.


One other thing.  These weather patterns are usually quite mild.  This will mean high snow levels.  They'll start off around 6,000 feet, and then rise to 8,000 feet on Friday and Saturday.  So this won't start building a mountain snow pack.  Yet.  

Colder air moves into the area on Sunday.  Snow levels will be dropping through the day, so that by the evening they'll be 4,000-5,000 feet.  Unfortunately, this will be as the precipitation is ending.  Still, there's a good chance for the mountains to pick up a few inches.  Here's the average computer forecast for mountain snowfall Sunday and Monday.  


OK, it's not enough to ski on, but it's a start.  The cooler air will stick around through much of the week, so any snow that does fall in the mountains won't be going anywhere. Here's the computer temperature forecasts for the next 7 days in Spokane.  Notice that next week, high temperatures will be in the mid-40s.


In fact, many locations will see their first freezing temperatures of the season by Tuesday or Wednesday morning.  This weather pattern won't change for awhile.  Here's the 8-14 day temperature outlook.

This shows below-normal temperatures in the West, with a good chance of above-normal temperatures in the East.  So a rather cool start to November.


Saturday, October 3, 2015

Is the end of fire season expected soon?

So while we can't argue that the worst of fire season is behind us, it should be noted there are still fires burning across portions of the Inland Northwest. Here's is what satellite information was showing on the last day of September:

MODIS Visible Satellite Imagery from 9/30/15

While these fires are far from the raging infernos we saw earlier this summer, it's still rather impressive for the end of September or beginning of October.  However, as we all know this year is different. First off, look at these precipitation totals since the beginning of April

Idaho Precipitation % of normal 4/2/15-10/1/15

Washington Precipitation % of normal 4/2/15-10/1/15
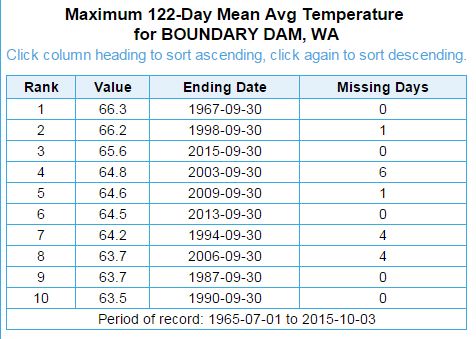
That is a lot of red and dark red shading over the Inland Northwest which correlates with meager precipitation amounts ranging 25-70% of normal. That's pretty dry. In fact, since the beginning of April through the beginning of October it was the driest period on record for both Spokane and Boundary Dam, WA (extreme NE corner of the state).

So combine the record dry conditions with nearly record warmth for both sites and it is no wonder the fire season has been so long. Here is a look at the temperatures for both sites.

So obviously record warm and dry conditions led to our active fire season, but unlike a typical year, things just aren't winding down as quickly as we are accustomed to. Climatologically, the days of active fires will be limited. We say that because the shorter days are leading to cooler temperatures and higher relative humidity levels  (both items are generally detrimental to good fire growth) while the chances for measurable precipitation are rising quickly. Climatologically the chance of measurable rain ranges from 20-25% over locations where the fires are currently burning. However by the end of the month those chances nearly double. So despite these facts, look at the latest fire danger ratings for the Inland Northwest:

Current Fire danger ratings
That map shows the fire danger is still high (yellow) or even very high (orange) across a sizable portion of the Inland Northwest, with moderate conditions (light green) found everywhere east of the Cascades. So what does that mean? According to the Wildland Fire Assessment System (WFAS) a high fire danger means, "All fine dead fuels ignite readily and fires start easily from most causes. Unattended brush and campfires are likely to escape. Fires spread rapidly and short-distance spotting is common. High-intensity burning may develop on slopes or in concentrations of fine fuels. Fires may become serious and their control difficult unless they are attacked successfully while small.

So is this danger level unusual for the beginning of October? Since 2006 (earliest year of  the graphical archive), the current fire danger has only been matched one time. That was in 2012. All other years saw low to moderate fire danger ratings across the area.


So what was the fire weather like in 2012? This satellite picture tells the story

MODIS Satellite imagery from 10/4/12

Just like this year, there were quite a few fires burning during the beginning of October. In fact, based on the satellite image, they were much bigger and included the Wenatchee Complex (southwest of Wenatchee) and the St. Mary's Misson Rd fire south of Omak. So what happened that year? The dry weather and fires continued to burn through the middle of the month, but several days of rain (not necessarily heavy) and cooler temperatures put an end to that fire season.

So what did the weather pattern look like for the end of that fire season? Well leading up to the end of the fire season, the upper-level pattern exhibited a large ridge parked right off the BC/WA coast with dry northwest flow over the region. Also, note the low-pressure area off the California Coast.

Early October 2012 500 mb pattern. 
So how does the pattern look for most of this week? Although it's far from identical, it does have some similarities, including the low near California, and the ridge over the Pacific Northwest.
500 mb pattern for Monday afternoon (10/5/15)
So what did the weather pattern that led to the end of the fire weather year in 2012 look like? The ridge broke down quite quickly and was replaced swift southwest flow into the Pacific Northwest and a deep low over the Gulf of Alaska. Again this brought cooler temperatures, periods of light rain (moderate in places), as well as significant cloud cover.
Mid-October 2012 500 mb pattern (Oct12-14)
How about this year? Is anything similar expected? Again although not a perfect match, there are some good similarities including a deep Gulf of Alaska low and deep southwest flow pointed into the Pacific Northwest from the eastern Pacific.
500 mb forecast for Oct 10, 2015
So how is our confidence in this solution and will this be the end of the fire season?  There are a few additional tools we can look at. One of the more interesting ones is called the NOMADS ensemble probability tool. This tool queries 21 GFS ensemble members or model runs and calculates the chances of any given parameter. Using this tool we can look at things such as what is our chance of seeing over a tenth of an inch of rain in a day?  When asking that particular question, here is the answer for the Grizzly Complex located over northern Shoshone County, ID.

The probability of seeing 0.10" of rain or more in 24 hrs over northern Shoshone County. 
So if you key in on the clustering of the blue bars, you can see that there is some consensus that by next weekend (10/10 and 10/11) that the weather pattern will support an increasing chance of rain (it peaks at 25% for the 24 hrs between 5pm Saturday through 5pm Sunday). Notice also that there is a small chance of light rain during the middle of the week.

Stay tuned and we shall see if this will truly be the end of a historically warm and dry fire season across the Inland Northwest.