Here is the scene from Sherman Pass east of Republic this morning.
The snow stick shows 5 feet on the ground. Below is a map showing snowfall totals that have been reported to us as well as a few SNOTEL sites. Thank you for all your reports!
 |
| 2 day snowfall reports (inches) ending Friday, March 2nd, 2018 |
As you can see there were huge variations in amounts. For example around 1" in Omak but just to the northwest of there 19" in Conconully! Also no snow accumulation in Oroville. Why the difference? Well temperatures in the lowest valleys generally stayed slightly above freezing through the event with rain, rain/snow mix, or a wet non-accumulating snow. Snow began to accumulate above 1500 feet with heavy snow totals for most areas above 2000 feet.
So why did this area get so much snow this time? Let's take a look at the pattern.
 |
| 00z/1st UW WRF-GFS forecast of 500mb heights/vorticity valid 18z (10 AM PST) Monday March 1st |
An unseasonably deep upper low sat off the coast before slowly inching its way into the region. Situational awareness tables (not shown) indicate lows of this magnitude occur about once every 10 years for this time of year. This flow pattern was very favorable for precipitation as southerly flow on the east side of the low provides no precipitation shadowing from the Cascades. Here is a series of satellite images showing multiple waves coming into the region from the south.
 |
| GOES-16 Infrared Satellite image valid 8 AM PST March 1st, 2018 |
 |
| GOES-16 Infrared Satellite image valid 9 PM PST March 1st, 2018 |
 |
| GOES-16 Infrared Satellite image valid 8 AM PST March 2nd, 2018 |
Note that on the latest image (8 AM March 2nd) there was still another wave lifting north. Good news is that after today, accumulating snow should be done for several days.
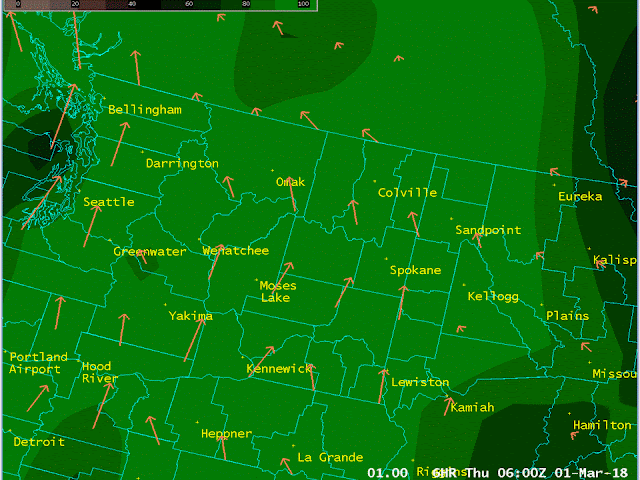
So why was this flow pattern so favorable? Here is one model depiction of moisture and wind during a portion of the event.
 |
| Model depiction of 700-500mb RH and 850 mb winds valid 6z Mar 1st (10 PM PST Feb 28th, 2018) |
As you can see all the green means lots of moisture. Then note the wind vectors out of the south-southeast. The next image below shows these same wind vectors overlayed with the terrain.
The green colors indicate lower valleys and plateaus while the brown colors are the mountains. Notice how the winds run generally from the lower elevations of the Columbia Basin into the higher terrain of the Okanogan Highlands. This provides added lift to generate more precipitation. In contrast, for weather systems with strong westerly flow, a large area of downslope off the higher terrain of the Cascades can create a precipitation shadow over this same area. The flow pattern is very important for snow totals in this area!
Republic has seen worse. For this event the official 2 day snow total of 14.0 inches tied for the 6th greatest 2 day snowfall on record. The Republic observation from Jan 2nd and 3rd of 1965 showed a total of 26.5" fell which is the snowiest 2 day period on record.


No comments:
Post a Comment