This past April, most
locations in the Inland Northwest saw above average temperatures and near
record breaking high temperatures. April of 2016 was the second warmest April
on record, falling just short of April 1934. The average temperature that is normally seen
in Spokane in April is 47.7°F. This past April reached an average
of a 54.7°F, a whopping 7°F above normal.
Below are the
charts from the Climate Prediction Center (CPC) with their outlook of what they
thought April would look like (on left) and on the right, what actually happened. They were
not too far off on their predicted temperatures in the Pacific Northwest. The entire region recorded much above average and a few locations,
such as the Palouse and northwest Montana, reached record breaking April temperatures.
 |
| CPC's temperature prediction vs. the obvserved average temperature for April 2016 |
The graph below shows the
temperature range that was observed (blue bars) at Spokane for the entire month of April, and
how that compares with both the normal temperature range and the record highs
and lows. The brown strip in the middle shows the normal temperature range while
the pink above shows the record high temperature and the light blue on the bottom shows
the record minimum temperature.
 |
| April 2016 temperatures at Spokane |
Lewiston also experienced
many days in which the temperature was above average. There were 16 days when
the high temperature was above average. Although that is not as many days as
Spokane saw, that was still over half of the month with above average temperatures. On the
opposite end of the spectrum, there were only 2 days when the minimum
temperature was below average.
 | |
|
Wenatchee also
experienced a similar trend with 23 days exceeding the average high temperature
and 6 of those days that broke max temperature records. Of the three cities we
are looking at, Wenatchee had only one day on which the minimum temperature was
below average.
 |
| Locations where the highest max temperature was broken within the month of April |
Not only were there record
highs, but there were also records for the warmest minimum temperature. This means
that the low temperature for nights in April were the the warmest night
temperatures that many locations have ever seen. There were 190 records
throughout Washington State where the highest minimums were recorded and 57
records that ties the previous.
 |
| Locations where the warmest minimum temperature was broken within the month of April
Now that we have talked about the
record breaking temperatures that were seen across the Inland Northwest, lets
see how that affected the snow pack on the mountains.
There is one thing that should be
clarified before we go into too much depth with the next few maps. There are
many automated observations in the mountains operated by the Natural Resources Conservation Service (NRCS). These are called SNOTELs (SNOw TELemetry) and they collect hourly information that is then transmitted to the NRCS. There are over 730 SNOTEL's that stretch over 11 states, typically in the mountains where access is either limited or restricted. In addition to measuring the depth of the snow, SNOTELs also measure snow water equivalent (SWE), which is simply the depth of water that would
cover the ground if the snow cover was in a liquid state.
One of the sensors that is on the part
of the SNOTEL is something called a snow pillow. Snow pillows are
"envelopes of stainless steel or synthetic rubber, about 4 feet square,
containing an antifreeze solution" (NRCS). When pressure is applied to the
snow pillow, an electrical reading is obtained and the data is transmitted to
the NRCS. The snow pillow essentially measures the weight of the snow that it on it. The weight of the snow is then converted to how many inches of snow water equivalent is in the snow. A foot of dry fluffy snow will have a lot less water in it than a few inches of old, slushy snow.
SNOTEL
|
 |
| Record snow melt amount in the month of April |
When we compare the snow
water equivalent with what was observed last year, we can see that there is a
huge difference at the end of March, but by the time we get to the middle of
May, we are in a similar situation as last year but not quite as extreme in some areas.
On March 30th,
2015, most of the basins had only 30-45% of their normal SWE. Some of the basins in western Washington had less than 10% of their normal SWE.
Comparing that to March 28th of this year, we can see a huge improvement. Most basins were near or above normal (i.e. greater than 100%).
 |
| SNOTEL Current Water Equivalent % of Normal- March 2015 and March 2016 |
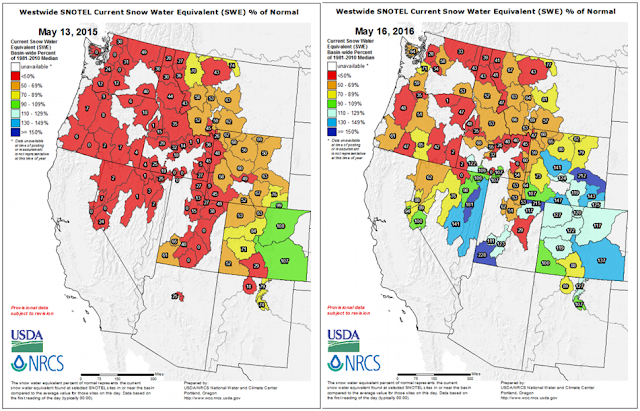
By May 13th, 2015, the snow pack was still far below normal
across Washington, Idaho, and Oregon. The SWE in the Spokane basin was only 30% of normal, along with the Idaho Panhandle and a few locations in the
Cascades at 0% of normal. During the spring of 2016, the Spokane basin went from being near-normal (96%) at the end of March, to only 43% of normal by mid-May. North Central Washington, which was well above normal at the end of March (137%), plummeted to only 33% of normal by mid-May. The warm temperatures that the Pacific Northwest
experienced in April took a huge toll on our snow pack.
 | |
|
The last charts that we are going to
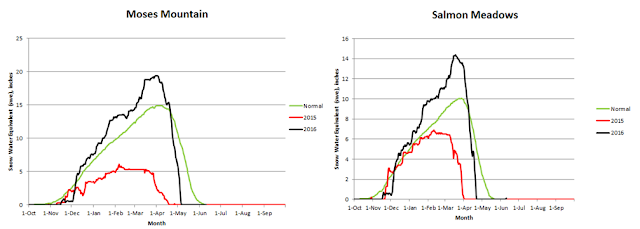
look at are select SNOTELs in the area so we can compare last year’s snowpack to this year's, and how those both compare to normal. The green line
indicates the normal that we would expect to see while the red is what was
observed in 2015 and black is what was observed this year. For most of the
locations noted below, you will see that the snow disappeared at least one
month earlier than normal.
These first two charts are from
SNOTEL's in the Washington Cascades. It
looked as though we were going to have a normal snow pack year (compare black line to green line). But once the warm
temperatures hit in April, the snow pack for both Blewett Pass and Lyman Lake melted rapidly. Blewett Pass lost all of its snow by mid April while Lyman Lake still has a little snow left Both are melting off more than a month earlier than normal. The average day when there is snow on Blewett Pass is May 28th but this
year is lost its snow by April 14th. Lyman Lake still has 11.3 inches of SWE on the ground while the average for this time is 31.2 inches of SWE.
|
| Western Washington SNOTEL's (Cascades) |
The next two locations are
located in the mountains of north-central Washington. By the time April 1 rolled around, those locations had an above
normal snow pack. But after the April heat, the SWE dropped below average. Both of these sites in north-central Washington lost their snow pack over a month earlier that normal. Moses Mountain usually loses its snow around June 11th but this year it lost it right around May 5th. Salmon Meadows typically has snow until May 28th but in 2016, its snow melted by April 21st.
 | |
|
For the eastern side of
Washington, Quartz Peak (Mt. Spokane) had above average snow fall during the winter. But the snow melted off about as fast as last year. 2015 had a lot less snow on Quartz Peak yet the
snow was gone within one day of each other on April 27th, 2015 and
April 28th, 2016 (normal is June 19th) . Spruce Springs snow pack was below normal for almost the entire winter, and the snow that they received
melted off almost a month and a half earlier than the normal. In 2016, Spruce
Springs lost the near-normal snow that it received by April 20th
(normal is June 11).
 |
| Eastern Washington SNOTEL's |
The last locations are in
the Idaho Panhandle, Lookout Pass and Mica Creek. Both sites received below average
snow for 2016, but it was still double what fell in 2015. But after the April heat of 2016, the snow pack was melted away about as early as in 2015. The last day
when there is typically snow on Lookout Pass is June 27th but for
2016 it was May 7th, a month and a half early. Mica Creek was very
similar to Lookout Pass with the average last day of snow being June 22nd
and the snow disappearing by May 4th, 2016.
 |
| Idaho Panhandle SNOTELS |
A year ago, we were looking back at a winter that had near-normal precipitation, but very little mountain snow. By June of 2015, the mountain snow pack was pretty much gone, with a hot dry summer yet to come. This lack of mountain snow had numerous impacts, including agricultural irrigation limitations and warm river water temperatures for fish.
The 2015/16 winter brought above average precipitation and near-normal mountain snowfall to the region. By the spring of 2016, things were looking very good for water supply. But then a very warm April melted almost all of the mountain snow pack. However, as we have shown, while the snow pack melted rapidly, the overall water supply situation is not quite as dire as it was by mid-June of 2015.


No comments:
Post a Comment