Thursday, June 23, 2016

Historical Hoopfest Weather


Historical Hoopfest Weather

Data compiled by the National Weather Service in Spokane. All times are PDT. All data recorded at the Spokane International Airport.

June 30 & July 1, 1990

June 30          High    83
                       Low     62                     

July 1             High    82      
                       Low     55
              
The first Hoopfest featured nearly perfect early summer weather conditions, with the basketball played under mostly sunny skies and temperatures topping out in the lower 80s.

June 29 & 30, 1991

June 29          High    65
                       Low     52
                       Precipitation 0.37 Inches

June 30          High    69      
                       Low     50
                       Precipitation 0.07 Inches

In sharp contrast to the initial season of Hoopfest, both days of this year’s Hoopfest featured weather more typical of Bloomsday.  A thunderstorm brought heavy rainfall to the area late Friday night and early Saturday morning, leaving behind wet courts to start the day off, along with cool temperatures.  The day remained cloudy with more showers to contend with in the afternoon.   Another thunderstorm moved through Spokane Saturday night between 9 pm and midnight.  Sunday was a cloudy and cool day with a few light showers in the afternoon.  It was windy however, with a southwest wind blowing at 20 mph and gusty.

June 27 & 28, 1992

June 27          High    93
                       Low     65

June 28          High    92      
                       Low     63
                       Precipitation 0.04 Inches

After a cool and wet Hoopfest in 1991, the 1992 was just the opposite.  Hoopfest begin on Saturday morning with Spokane in the grips of an unusual June heat wave.  Just a few days before the beginning of Hoopfest Spokane set an all-time record high for the month of June when the temperature hit 101 degrees on June 23.  This hot weather pattern continued right on through the Hoopfest weekend.  Saturday was hot and sunny, though the high of 93 may have felt better to many considering the hot temperatures of the days before.  Sunday, while just about as hot, saw in increase in cloud cover ahead of a strong frontal system to end the month.  By 3 pm thunderstorms moved into the city lasting through the evening.

June 26 & 27, 1993

June 26          High    90
                       Low     55
                       Precipitation 0.04

June 27          High    69      
                       Low     52

Saturday saw hot temperatures and full sunshine ahead of a frontal system moving into the city.  Late Saturday evening thunderstorms moved through downtown.  Fortunately the rain fell overnight and by Sunday morning only high elevation clouds were observed.  Temperatures were much cooler on Sunday, down over 20 degrees from Saturday’s hot readings.
          
June 25 & 26, 1994

June 25          High    86
                       Low     45
                       Precipitation Trace

June 26          High    65
                       Low     49
                       Precipitation 0.25 Inches

The 1994 edition of Hoopfest saw weather conditions quite similar to the preceding year.  Saturday was a warm and sunny day with almost no wind.  A frontal system brought widespread showers to the city early Sunday morning.  Fortunately most of the precipitation ended by 5 am.  Sunday was a cool, cloudy and very windy final day of Hoopfest.  Winds blew from the southwest at 20 to 25 mph with gusts over 30 mph.

June 24 & 25, 1995

June 23          High    80
                       Low     51

June 24          High    85      
                       Low     54

Uneventful weather marked this year’s Hoopfest, with cool mornings and warm afternoons under light winds and almost full sunshine.
                      
June 29 & 30, 1996

June 29          High    72
                       Low     44

June 30          High    80      
                       Low     49

Similar to last year’s Hoopfest, but with cooler temperatures.  Both days were played under full sunshine.  Many would call this the perfect Hoopfest weather weekend.
 
June 28 & 29, 1997

June 28          High    78
                       Low     44
                       Precipitation 0.01

June 29          High    68       
                       Low     52
                       Precipitation Trace

Another sunny Hoopfest day on Saturday with temperatures right at average that afternoon.  Increasing clouds Saturday night with a brief shower near midnight.  Cooler on Sunday under cloudy skies and southwest winds 10 to 20 mph.

June 27 & 28, 1998

June 27          High    73
                       Low     47

June 28          High    82      
                       Low     48

Partly cloudy and cool on Saturday, followed by warmer temperatures in the lower 80s under mostly sunny skies for Sunday.

June 26 & 27, 1999

June 26          High    64
                       Low     44

June 27          High    70      
                       Low     45
          
What a difference a day makes!  Had Hoopfest been one day sooner then a true washout would have occurred, as Friday was a wet day with 0.85 inches of rain.  Fortunately the weather system responsible for the wet weather moved on and Saturday, while unseasonably cool was dry.  Sunday saw another cool day with partly cloudy skies.

June 24 & 25, 2000

June 24          High    74
                       Low     52
                       Precipitation Trace

June 25          High    77      
                       Low     49

Saturday featured mostly cloudy skies and seasonable cool temperatures.  A brief shower or sprinkles moved across the area in the afternoon, leaving only trace amounts of rainfall.  Similar temperatures occurred on Sunday but with much more sunshine.

June 23 & 24, 2001

June 23          High    73
                       Low     57

June 24          High    66      
                       Low     48
                       Precipitation 0.02 Inches

This was another cool Hoopfest.  Saturday saw temperatures in the lower 70s under partly cloudy skies.    Sunday was cooler still with cloudy skies.  Light showers moved into the area by late Sunday afternoon.

June 29 & 30, 2002

June 29          High    72
                       Low     50
                       Precipitation 0.27 Inches

June 29          High    71      
                       Low     47

Yet another cooler-than-average Hoopfest.  After several hot days right before Hoopfest, temperatures cooled off right in time for the weekend.  The frontal system responsible for the cooler weather also brought with it a period of rain Friday night and Saturday morning.  But as has been the case in several past Hoopfests, the rain ended right at 5am Saturday morning, leaving behind cloudy, cool and windy weather for Saturday, but fortunately no rain!  Sunday was a cool day under mostly sunny skies.

June 28 & 29, 2003

June 28          High    88
                       Low     55

June 29          High    93      
                       Low     57

The streak of cool temperatures on Hoopfest ended in an abrupt manner for the 2003 Hoopfest.  Saturday was a hot and sunny day more typical of July.  Sunday was even hotter, with blistering temperatures in the 90s.  The high temperature of 93 tied 1992 for the hottest Hoopfest temperature, which would later be broken in 2008.

June 26 & 27, 2004

June 26          High    78
                       Low     62
                       Precipitation Trace (Thunderstorms)

June 27          High    81      
                       Low     57

Thunderstorms were the main concern for Hoopfest on Saturday.  By late Saturday morning, thunder and lightning was observed very close to downtown.  One thunderstorm brought a brief downpour to the event around lunchtime, but fortunately the heaviest rain from this thunderstorm moved just north of downtown.  The storms decreased by afternoon, leaving the rest of Hoopfest dry with seasonable temperatures, though a little bit on the muggy side for Spokane.

 June 25 & 26, 2005

June 25          High   79
                       Low    57
                     
June 26          High   80      
                       Low    54

Ideal weather conditions greeted this year's participants, with mild temperatures and some high clouds both days. The 2 days after Hoopfest were markedly different. Both had around a third of an inch of rain with temperatures only in the mid 60s.

June 24 & 25, 2006

June 24          High   84
                       Low    50
                      
June 25          High   90      
                       Low    57

Warm temperatures on Saturday gave way to hot readings on Sunday. Hoopfest players and spectators were treated to abundant sunshine on both days.

June 30 & July 1, 2007

June 30          High    73
                       Low    51
                     
July 1             High    82      
                       Low     51

Hoopfest dodged a weather bullet in 2007. On the Friday before the start of Hoopfest, strong thunderstorms rumbled through the Spokane metro area bring rain, hail, damaging winds and lightning. But the storms moved out of the area by late afternoon, allowing the final preparations to be made for the weekend's activities. Weather on Saturday and Sunday was ideal, with only some high clouds and light winds.

June 28 & 29, 2008

June 28          High   92
                       Low    58
                     
June 29          High   97      
                       Low   64

The 2008 edition of Hoopfest easily goes down as the hottest Hoopfest yet. The previous record hot Hoopfest was 93 degrees in 2003 and 1992. The Saturday 2008 reading of 92 came close, but the Sunday high of 97 shattered the old records. While this was the hottest Hoopfest temperature (i.e. since its inception in 1990), there have been highs as hot as 102 degrees during the late June/1st of July period (see records at the top of this page). In 2008, winds were light and skies were mostly sunny so there was little in the way of relief from the hot weather.

June 27 & 28, 2009

June 27          High   79
                       Low    49
                     
June 28          High   81      
                       Low    55

Unlike the hot weather in 2008, the Hoopfest of 2009 was held in just about perfect conditions. Temperatures were around 80 both days under sunny skies. Sunday even had a nice breeze to keep things from getting too warm.

June 26 & 27, 2010

June 26          High   79
                       Low    55
                      
June 27          High   79      
                       Low    52

A virtual repeat of 2009, Hoopfest 2010 had ideal weather for outdoor recreation. Temperatures were around 80 both days under mostly sunny skies. The winds did kick up a bit both afternoons.


June 25 & 26, 2011


June 25            High 67
                         Low 43

June 26            High 73 
                         Low 43


Hoopfest 2011 was cooler than the previous year with the high temperature about 9 degrees below normal on the 25th warming to only 4 degrees below normal on the 26th. Clouds were minimal throughout the day on the 26th with a southwest wind to 10 mph. The 27th was sunny with even lighter wind.

June 30 & July 1, 2012


June 30             High 78
                          Low 60
                          Precipitation: Trace

July 1                 High 78 
                          Low 59
                          Precipitation: Trace

At first glance, Hoopfest 2012 was held under near-ideal weather conditions. The high temperature of 78 on both days was within 1 degree of normal readings for this time of year. The morning low temperatures were rather mild. But the unusual part was the humidity, which was rather high for our area. Dewpoints were in the mid-50s both days. Skies were mostly cloudy, with a few sprinkles, but not enough to cause any impact to the games.

June 29 & 30, 2013

June 29             High 76
                          Low 62
                          Precipitation: 0.06

June 30             High 91 
                          Low 59
                          Precipitation: 0.00

Saturday, June 29th started out as a very cloudy day with thunderstorms in the area and high high dewpoints indicating a significant amount of moisture in the air. The cloud cover and showers kept temperatures down. The next day on Sunday, saw drier and much warmer conditions and partly cloudy skies which helped temperatures recover back to around 90 degrees by Sunday afternoon..


June 28 & 29, 2014


June 28              High 72
                           Low 52

June 29              High 71 
                           Low 50

Wet thunderstorms moved through Spokane on Friday evening bringing a quarter inch of rain to downtown. While this rain played havoc with evening court preparation activities, the weather for the games was much drier.  Saturday morning started with low overcast skies, but the sun broke through later in the day. Temperatures were mild but it was rather windy. Sunday saw a little more sunshine but it continued to be breezy.

June 27 & 28, 2015


June 27              High 102
                           Low 68

June 28              High 105 
                           Low 73

Hoopfest 2015 took place in the midst of the warmest June on record for northeast Washington and the North Idaho Panhandle and right in the middle of a historic heatwave from the 26th through the 30th. Spokane International Airport recorded temperatures of 102 and 105 respectively, both of which were daily records. The 105 degree temperature at the airport was also a record high for the entire month of June as well. Temperatures at Spokane Felts Field were even a couple of degrees higher than that.


Wednesday, June 22, 2016

What does our drought look like so far this year?

If you lived in the Inland Northwest last year, you will remember the extent of the severe drought which played a huge role in the extreme fire season that we experienced. When fire season ended last year, 913,430 acres burned, which broke the record that was previously set in 2014 of 367,199 acres. 

There are many factors to look at when trying to identify if we're facing a drought season again, and will it be as severe as last year. One of the largest factors is the snow pack that our mountains received. Washington and the Idaho Panhandle received more snowfall than the previous year but not quite to the level that would be considered normal. Although Spokane is not in the mountains, it is a good representation of how the snowfall varied from the previous year. Spokane typically receives an average of 44.9" of snow, but the winter of 2014-2015 brought only 17.6" of snow. This last winter brought 34.2" of snow, double what the previous winter received,with 24.1" of snow accumulating in December alone. Even though that is still below average, that has helped slow the onset of another extreme drought like last year. 

When we started May off last year, the drought was already in effect for most of the Inland Northwest. Compare that to this year, we are already looking at better conditions, but that does not mean that those conditions won't worsen over the next few months. At the start of May 2015, we can see that all of Idaho, Oregon, and a large portion of Washington had some sort of drought that was effecting the area. When we look at the same week in 2016, only a small portion of Washington and Idaho is classified as a D0 (abnormally dry). Oregon has a worse drought in May 2016 compared to how Washington and Idaho look but they are still better off than they look from 2015 with levels only reaching a D1 (moderate drought)
U.S. Drought Monitor: May 2015 (left) vs. May 2016 (right)


When we fast forward a month and a half, we can see that the drought back in 2015 worsened for most of the West. In 2015, the southern portion of Washington stayed in a severe drought while the north eastern portion was upgraded from a moderate drought to a severe drought. When we look at how look at how 2016 has advanced, Washington went from have a D0 (abnormally dry) over the southern portion along the Oregon boarder to a D0 across most of the State as well as the Idaho Panhandle. The Southern portion that was only at a D0 has been upgraded to a D1 (moderate drought). Although it looks like we will have some type of drought over Washington, we will have to see how it advances over the coming months.
U.S. Drought Monitor: June 2015 (left) vs. June 2016 (right)


Due to the drought that was already in place in May of last year, many of what we call fire fuels, were ready to burn starting early in the season. We have a classification for what we call fire fuels based on the size of the object. We have 10 hour fuels (1/2" diameter), 100 hour fuels (1-3" diameter), and 1000 hour fuels (3-8" diameter).The fuels hours represent the modeled moisture content of dead fuels based on the min and max temperature of the day, relative humidity as well as the precipitation from the previous 24 hours. We are going to look at the 100 hour fuels which, based on our classification, would be small trees. 

When we look at the two maps below, we can see that at the beginning of May, a majority of our fuels contained less moisture than the previous year. The fuels in the Idaho Panhandle during this time frame contained much more moisture than the previous year, limiting their burn ability. The fuels East of the Cascades were also contained more moisture than last year, although it is not much more.
100 Hour Fuels: May 5, 2015 vs. May 3, 2016

When we compare that to this week in June, we can see that there has not been a large change in the fuels for the Idaho Panhandle or the Eastern portion of Washington. This is mainly due to the cool off that we had this last week that brought moisture to most of the area. Before the cool off that started on June 10th, the fuels were drier than 2015. The current forecast for the next week is showing a drier and warmer forecast for most of the area, meaning that our fuels are going to be drying out once again.
100 Hour Fuels: June 16, 2015 vs. June 14, 2016


These next maps show what the stream levels looked like in 2016 and how that they compare with last year. We can see that there were more locations in the Cascades that were much below normal than in 2016. However, that does not mean that we are not going to experience some level of drought this year. We are going to look at a few of these locations in more depth and try to understand how we currently compare to last year.  

Stream flow levels: 2015 (left) vs. 2016 (right)


The first river we will look at is the Spokane River. We can look at how June 13, 2016 compares to the exact day a year ago. We can see that with very little snowfall during the winter of 2014-2015 that the river was already at low levels even during the middle of June. Compare that to a year when there was more snowfall on the ground and you can tell that the stream flow is much higher. Although the Spokane River flow is currently only in the 7th percentile of where we should be in mid-June, we are still starting out the summer better this year than we were at this time last year. 
Spokane River Stream flow from January 1, 2015- June 13, 2016

Wenatchee was another location where the stream flow level was much below normal, but compared to where we were last year, we have made a slight improvement. We can also see that the stream flow for this spring was higher than last year thanks to the snowpack in the mountains. 

Wenatchee River  Stream flow from January 1, 2015- June 13, 2016


When we look at the Kettle Rive up near Ferry, WA, we are seeing a very similar trend to Wenatchee. There is a increase in the stream flow but it is not quite as impressive as the Spokane River. We can also see that there was higher spring runoff thanks to the higher snowpack in that basin this past winter.
Kettle River Stream flow from January 1, 2015- June 13, 2016


The last location we are going to look at is St. Joe River in Calder, ID. We can see that the stream flow is about the same level for both 2015 and 2016 but the timing of the peak was different. For 2015, the peak flow was around March and April while in 2016 it was more towards May and lasted a lot longer. The current flow in the St Joe is in the 11th percentile of what we would expect for this time of the year.

St. Joe River Stream flow from January 1, 2015- June 13, 2016


As you can see, the stream flow for almost all locations across the Inland Northwest have had improvement from last year. It's important to note that although we do have more flow in many locations than we did at this time last year, many rivers are still far below their average flows and will continue to drop through the summer. This means that we can expect to hit low flows earlier in the season, which can have impacts on water rights, fish, and groundwater levels, among other things. 

Thursday, June 16, 2016

Warm April temperatures and what that meant for our snow pack

This past April, most locations in the Inland Northwest saw above average temperatures and near record breaking high temperatures. April of 2016 was the second warmest April on record, falling just short of April 1934. The average temperature that is normally seen in Spokane in April is 47.7°F.  This past April reached an average of a 54.7°F, a whopping 7°F above normal.  

Below are the charts from the Climate Prediction Center (CPC) with their outlook of what they thought April would look like (on left) and on the right, what actually happened. They were not too far off on their predicted temperatures in the Pacific Northwest. The entire region recorded much above average and a few locations, such as the Palouse and northwest Montana, reached record breaking April temperatures. 


CPC's temperature prediction vs. the obvserved average temperature for April 2016


The graph below shows the temperature range that was observed (blue bars) at Spokane for the entire month of April, and how that compares with both the normal temperature range and the record highs and lows. The brown strip in the middle shows the normal temperature range while the pink above shows the record high temperature and the light blue on the bottom shows the record minimum temperature. 


We can see that Spokane's high temperature was above normal for 22 days, while there were only 3 days when the temperature was below normal. Record high temperatures were reached on April 8th, 19th, and 20th 
April 2016 temperatures at Spokane


Lewiston also experienced many days in which the temperature was above average. There were 16 days when the high temperature was above average. Although that is not as many days as Spokane saw, that was still over half of the month with above average temperatures. On the opposite end of the spectrum, there were only 2 days when the minimum temperature was below average.  
April 2016 temperatures at Lewiston


Wenatchee also experienced a similar trend with 23 days exceeding the average high temperature and 6 of those days that broke max temperature records. Of the three cities we are looking at, Wenatchee had only one day on which the minimum temperature was below average. 
April 2016 temperatures at Wenatchee


As previously mentioned, there were multiple days when the high temperature record was broken. The map below shows the locations where records were broken in Washington. For many of these locations, there were multiple days where the record was broken or tied. We can see below that there were 254 broken records and 49 that were tied. 
Locations where the highest max temperature was broken within the month of April

Not only were there record highs, but there were also records for the warmest minimum temperature. This means that the low temperature for nights in April were the the warmest night temperatures that many locations have ever seen. There were 190 records throughout Washington State where the highest minimums were recorded and 57 records that ties the previous.
Locations where the warmest minimum temperature was broken within the month of April


Now that we have talked about the record breaking temperatures that were seen across the Inland Northwest, lets see how that affected the snow pack on the mountains. 

There is one thing that should be clarified before we go into too much depth with the next few maps. There are many automated observations in the mountains operated by the Natural Resources Conservation Service (NRCS).  These are called SNOTELs (SNOTELemetry) and they collect hourly information that is then transmitted to the NRCS. There are over 730 SNOTEL's that stretch over 11 states, typically in the mountains where access is either limited or restricted. In addition to measuring the depth of the snow, SNOTELs also measure snow water equivalent (SWE), which is simply the depth of water that would cover the ground if the snow cover was in a liquid state. 


One of the sensors that is on the part of the SNOTEL is something called a snow pillow. Snow pillows are "envelopes of stainless steel or synthetic rubber, about 4 feet square, containing an antifreeze solution" (NRCS). When pressure is applied to the snow pillow, an electrical reading is obtained and the data is transmitted to the NRCS.  The snow pillow essentially measures the weight of the snow that it on it.  The weight of the snow is then converted to how many inches of snow water equivalent is in the snow.  A foot of dry fluffy snow will have a  lot less water in it than a few inches of old, slushy snow.

SNOTEL


In order to find out how much snow melted in April, NRCS took the observed SWE on May 1st and subtracted the observed SWE from April 1stThe red dots indicate the locations where more snow melted in the month of April than any other April in previous years. The orange dots that are on the map represent the second highest recorded snow melt amount for April.  In other words, many of the SNOTELs in the Northwest saw their fastest April snow melt on record.  But records for many of these sites only go back to the 1980s.  
Record snow melt amount in the month of April


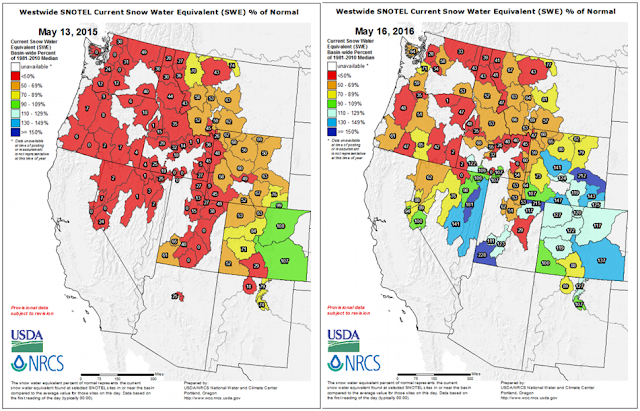
When we compare the snow water equivalent with what was observed last year, we can see that there is a huge difference at the end of March, but by the time we get to the middle of May, we are in a similar situation as last year but not quite as extreme in some areas. 

On March 30th, 2015, most of the basins had only 30-45% of their normal SWE.  Some of the basins in western Washington had less than 10% of their normal SWE. Comparing that to March 28th of this year, we can see a huge improvement.  Most basins were near or above normal (i.e. greater than 100%).
SNOTEL Current Water Equivalent % of Normal- March 2015 and March 2016

By May 13th, 2015, the snow pack was still far below normal across Washington, Idaho, and Oregon. The SWE in the Spokane basin was only 30% of normal, along with the Idaho Panhandle and a few locations in the Cascades at 0% of normal. During the spring of 2016, the Spokane basin went from being near-normal (96%) at the end of March, to only 43% of normal by mid-May. North Central Washington, which was well above normal at the end of March (137%), plummeted to only 33% of normal by mid-May. The warm temperatures that the Pacific Northwest experienced in April took a huge toll on our snow pack.  
SNOTEL Current Water Equivalent % of Normal- May 2015 and May 2016
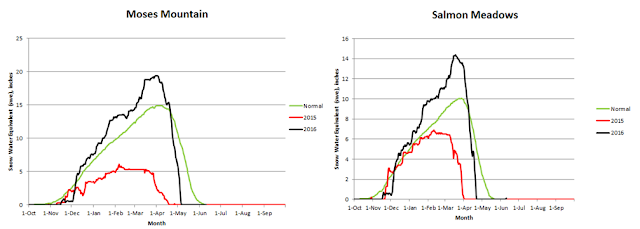
The last charts that we are going to look at are select SNOTELs in the area so we can compare last year’s snowpack to this year's, and how those both compare to normal. The green line indicates the normal that we would expect to see while the red is what was observed in 2015 and black is what was observed this year. For most of the locations noted below, you will see that the snow disappeared at least one month earlier than normal. 

These first two charts are from SNOTEL's in the Washington Cascades. It looked as though we were going to have a normal snow pack year (compare black line to green line).  But once the warm temperatures hit in April, the snow pack for both Blewett Pass and Lyman Lake melted rapidly.  Blewett Pass lost all of its snow by mid April while Lyman Lake still has a little snow left  Both are melting off more than a month earlier than normal.  The average day when there is snow on Blewett Pass is May 28th but this year is lost its snow by April 14th. Lyman Lake still has 11.3 inches of SWE on the ground while the average for this time is 31.2 inches of SWE. 
Western Washington SNOTEL's (Cascades)

The next two locations are located in the mountains of north-central Washington. By the time April 1 rolled around, those locations had an above normal snow pack.  But after the April heat, the SWE dropped below average. Both of these sites in north-central Washington lost their snow pack over a month earlier that normal. Moses Mountain usually loses its snow around June 11th but this year it lost it right around May 5th. Salmon Meadows typically has snow until May 28th but in 2016, its snow melted by April 21st.
Central Washington SNOTEL's

For the eastern side of Washington, Quartz Peak (Mt. Spokane) had above average snow fall during the winter.  But the snow melted off about as fast as last year. 2015 had a lot less snow on Quartz Peak yet the snow was gone within one day of each other on April 27th, 2015 and April 28th, 2016 (normal is June 19th) . Spruce Springs snow pack was below normal for almost the entire winter, and the snow that they received melted off almost a month and a half earlier than the normal. In 2016, Spruce Springs lost the near-normal snow that it received by April 20th (normal is June 11).
Eastern Washington SNOTEL's


The last locations are in the Idaho Panhandle, Lookout Pass and Mica Creek. Both sites received below average snow for 2016, but it was still double what fell in 2015. But after the April heat of 2016, the snow pack was melted away about as early as in 2015.  The last day when there is typically snow on Lookout Pass is June 27th but for 2016 it was May 7th, a month and a half early. Mica Creek was very similar to Lookout Pass with the average last day of snow being June 22nd and the snow disappearing by May 4th, 2016. 
Idaho Panhandle SNOTELS


A year ago, we were looking back at a winter that had near-normal precipitation, but very little mountain snow.  By June of 2015, the mountain snow pack was pretty much gone, with a hot dry summer yet to come.  This lack of mountain snow had numerous impacts, including agricultural irrigation limitations and warm river water temperatures for fish.

The 2015/16 winter brought above average precipitation and near-normal mountain snowfall to the region.  By the spring of 2016, things were looking very good for water supply.  But then a very warm April melted almost all of the mountain snow pack.  However, as we have shown, while the snow pack melted rapidly, the overall water supply situation is not quite as dire as it was by mid-June of 2015.