Yesterday's blog hopefully gave you a taste of the variability in the weather computer forecasts for the upcoming winter storm. Late last week, the computer models had pretty good agreement on a heavy snowfall event. But over the weekend, a few new scenarios developed for how much snow we will get and when. Let's take a look at the latest forecasts to see if we have any new scenarios or possibly agreement.
There is good agreement on the start of the snow event, so we have high confidence for this.
- Light snow will start in the Cascades late Tuesday afternoon.
- North-central Washington will get about an inch of snow Tuesday evening.
- Snow should reach the Spokane/CdA metro by Wednesday morning.
- North-central Washington should have 3-5" of snow by sunrise Wednesday.
- Snow will spread over the remainder of the Inland NW by about 10am Wednesday.
How much snow falls during Wednesday is still quite variable. Most of the computer forecasts still point to the heaviest snowfall along a line from about Lake Chelan, to Keller, to Deer Park, to Sandpoint. Here's the ECMWF forecast for this time period:
Most readers will note that the ECMWF still has a very low snowfall amount forecast for Spokane (i.e. 2.7"). It's been fairly consistent over the past 2 days of predicting a "low snow" event for the metro.
Compare that to the GFS, which has really stuck to its guns, saying that Spokane is going to get nailed with snow (11.5"):
What's interesting is that the 2 models have a similar overall pattern, with the heavy snow band oriented west-to-east. The difference is in the exact placement. If that band is farther north, Spokane will have a ho-hum event. Farther south, and we're talking significant snow for the metro area.
Here's some other computer forecasts for that same time period:
Again all have the same basic overall pattern, just a little different in the exact location of the heaviest band of snow. Here's a summary table for a few locations, along with the average of those 5 computer models.
| ECMWF | GFS | Canadian | NAM | UKMET | Average |
Spokane | 2.5” | 11.5” | 5.7” | 2.6” | 5.2” | 5.5” |
Sandpoint | 7.7” | 5.1” | 6.7” | 3.7” | 8.0” | 6.2” |
Pullman | 3.2” | 2.0” | 5.8” | 2.9” | 5.3” | 3.8” |
Omak | 2.9” | 2.2” | 1.9” | 6.9” | 3.0” | 3.4” |
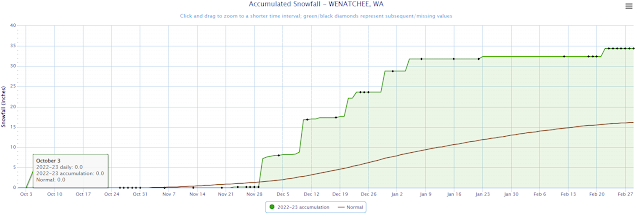
Wenatchee | 4.9” | 2.1” | 1.6” | 3.2” | 1.4” | 2.6” |
Moses Lake | 1.6” | 2.2” | 1.3” | 1.3” | 1.7” | 1.6” |
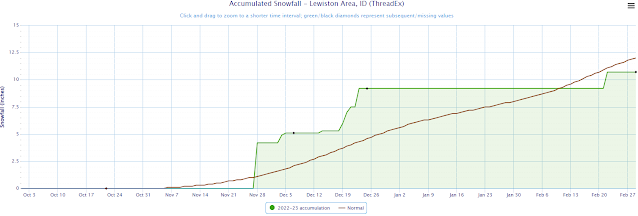
Lewiston | 0.7” | 1.3” | 0.5” | 0” | 0.2” | 0.5” |
Remembering from the previous blog, all of these numbers we shown you are calculated using a 10:1 ratio of snow vs liquid. Given how cold temperatures are, the ratio will most likely be closer to 15:1 or even higher. So all of these numbers should be increased about 50% to get a more realistic snowfall forecast.
For Thursday, the snow slowly sags into southeast Washington the southern Idaho Panhandle, as it ends in north-central and northeast Washington. Pullman and Lewiston have their best chances for heavy snow on Thursday, with an additional 3-5" possible.
Looking at these forecasts (as well as other models not shown here), and adding local forecaster experience, this is the current official forecast for snowfall.
One other factor to address is that temperatures on Wednesday will get warmer. This isn't unusual. A strong low pressure system off the WA/OR coast will bring warmer air northward. The forecast high temperature at Spokane Airport is 33F, and 35F for downtown, which could limit snow accumulations in the afternoon a bit. That won't be an issue for folks living to the north of Spokane.


")


.png)
.png)
.png)
.png)
.png)
.png)
.png)
.png)
.png)
.png)
.png)
.png)
.png)
.png)
.png)
.png)

