Sunday, October 29, 2023

El Niño and the Winter Outlook 2023-24

What will this winter bring?  In a previous blog post, found here, we talked about how El Niño could impact our fall weather.  Now we will take it a step further and examine the winter.

In case you haven't heard, there is a 100% chance of an El Niño this winter!  This is guaranteed.  And there is an 80% chance the event will be classified as a strong El Niño.  Below is the typical pattern associated with an El Niño winter.  Typically the polar jet stream stays well to our north and east while an active Pacific Jet Stream sends wet weather into the west coast (especially California).  But as you'll see later that is certainly no guarantee.

Typical Jet Stream Pattern associated with El Nino

While the impacts locally are not the same for every El Niño winter,  the winters favor warmer than normal temperatures.  We will talk about precipitation and snow later.

So how is the current El Niño looking?  As the graphics below show, there is plenty of warmer than normal water along the Central and Eastern Equatorial Pacific.

Average Sea Surface Temperature Anomalies Sep 24-Oct 21, 2023 (left image).  Specific anomalies for Nino regions (right image)

The Niño 3.4 region already has an anomaly of 1.6C (3 F).  Anything 1.5C or warmer would classify as a strong event if this intensity maintains itself for three or more months.

The model predictions are calling for not only for these warm waters to maintain themselves, but to get even warmer through the remainder of the fall and early winter

Model predictions of Nino 3.4 Sea Surface Temperature Anomalies through JJA (June, July, August 2024)

Why does this warm water matter when it is so far away?  The why can be found in this September 29th blog post from the Climate Prediction Center (CPC), found here.

Since 1980, composite temperature and precipitation anomalies of Strong El Niño winters (shown below) reveal that on average, Strong El Niño winters result in warmer than normal temperatures, while precipitation has been slightly above normal in Central Washington, and slightly drier than normal over SE Washington into the south Idaho Panhandle.

Left Image: Average temperature anomalies of the 1982-83, 1991-92, 1997-98, 2009-10, and 2015-16 Strong El Niño Events.  Right Image: Averaged Standardized Precipitation Anomalies for those same events

It is important to mention here that this only includes five events (small sample size).  Due to the influence of climate change, there is some reluctancy to put as much weight into earlier cases.  However, the maps below show all strong events (8 in total) since 1950.  Let's begin with temperature:

Temperature anomalies observed from previous Strong El Niño events

And now precipitation:

Precipitation anomalies observed from previous Strong El Niño events


Here are the key takeaways from previous Strong El Niño Winters
  • Every event since 1980 has been warmer than normal
  • Precipitation varies significantly.   Some years have been wet, some dry, and some near normal.

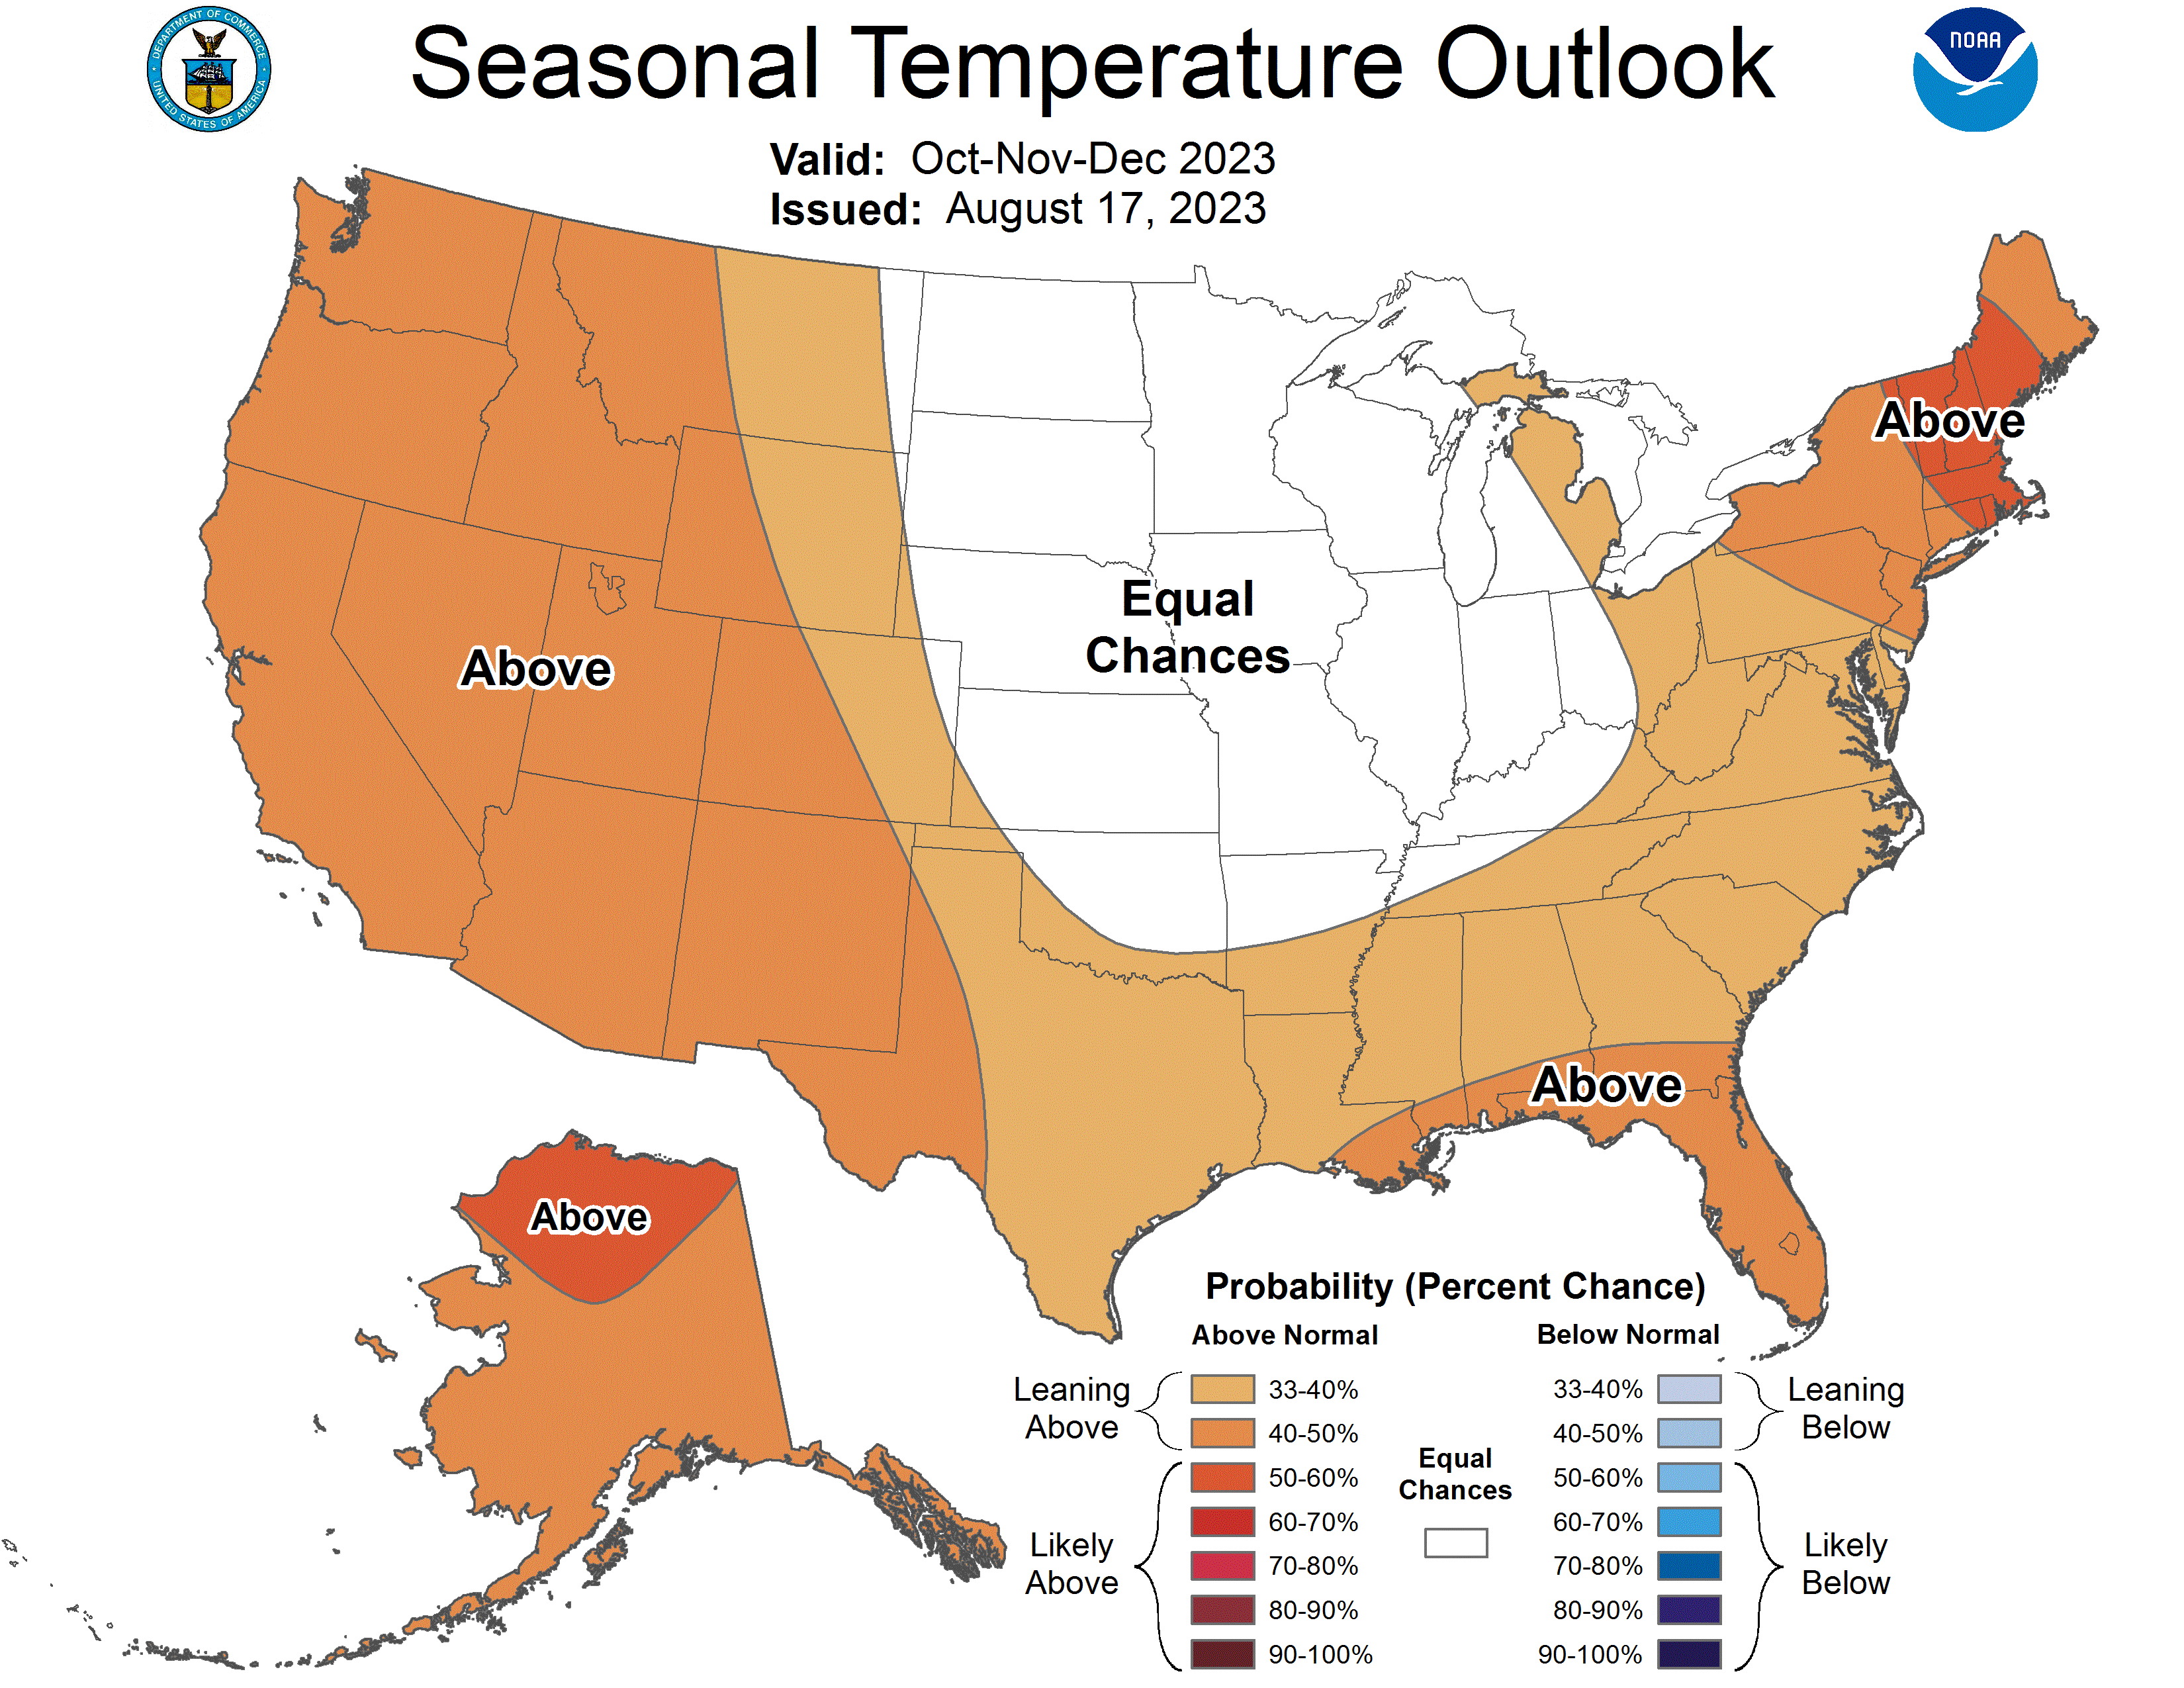
So, what do the official outlooks call for this winter?  The CPC is calling for an 89% chance that temperatures will finish near to above normal (56% above normal, 33% normal), and only a 11% chance of the winter finishing cooler than normal as shown below.

Climate Prediction Center Dec 2023 - Feb 2024 Temperature Outlook.  The green icon on map is over Spokane, WA with the pie charts on left side of graphic showing various temperature and precipitation probabilities for the period

Note the bottom left pie chart which is the precipitation forecast.  Consistent with previous cases, there isn't much weight put into any one category, with all outcomes carrying nearly equal weight.

The warmer than normal temperatures themselves tends to reduce snowfall amounts for the lower elevations.  Below is a map of % of normal snowfall for ALL El Niño Winters from 1950-2015

Percent of normal snowfall averaged over all El Nino years from 1950-2015

As you can see, just about every town on average sees below normal snowfall.  Want to fiddle with this page some more?  Well you are in luck, an interactive version can be found here.  Each location when clicked on will bring up a chart showing average snow amounts for all three ENSO States (El Niño, La Niña, and Neutral).

There are two important things to point out regarding snowfall for the Inland NW.  

  1. The Palouse area and Spokane area historically received the greatest reduction in snow during El Niño events compared to normal.  Since we are heading into a strong El Niño, we examined previous events for Moscow and Spokane (shown below).  
  2. Communities from the East Slopes of the Cascades up into the Okanogan Highlands including Leavenworth, Chelan, Winthrop, and Republic show much more variability with amounts. 
Let's start with Moscow, ID.  Every strong El Niño event since the 1970s has brought below normal snow, with most years only receiving around 20-30" versus a normal near 50"!


For the Spokane International Airport, EVERY strong El Niño event since 1950 has brought below normal snow except 1965-66 which was near normal.


And for Wenatchee, snow amounts are quite variable.


If you live in North Central Washington, the presence of El Niño won't really help much regarding the seasonal snow prediction.  Because of this there is higher uncertainty with the snow forecast for these areas.

Interested in reading more about how El Niño can impact snow over North America?  The Climate Prediction Center recently published a blog post going into more detail, found here.

Finally, while El Niño plays a role for the winter as a whole, short term variations in the weather (lasting 1-3 weeks) commonly occur as other atmospheric variables impact the weather pattern.  These can have impacts over the region including strong winds, flooding, cold temperatures, and a variety of winter precipitation types including snow, sleet, and freezing rain.  With that in mind, it is always wise to be prepared for winter weather.  In fact, winter weather already struck parts of the region on October 27, 2023 creating slick roads as these images from WSDOT showed on I-90 near the Four Lakes area.

Oct 27th, 2023 - Photo courtesy of WSDOT on X (Twitter)

Oct 27th, 2023 Photo courtesy of WSDOT on X (Twitter)


Monday, October 23, 2023

Major pattern change this week - Snow and Cold!

 *Oct 24th Update to Snow Probability Map animation embedded below*

Have you heard?  Big weather changes are coming this week.  If you have not winterized your outdoor faucets and irrigation, NOW is the time!  And do you have travel plans this week?  Roads may be impacted by snow and/or ice, especially up over the mountain passes.  Of course with the varying terrain of the Inland NW, the snow part of the forecast will vary by location.  But regarding the cold everyone will be impacted.  Let's dive into the details.


The setup

What is the pattern that will cause this cool down? A high amplitude ridge to our west will allow a cold trough to settle over the region.

12z GFS 500 mb heights and anomalies valid Oct 23-27th, 2023

First hazard: Snow

A low pressure system swinging through the region will bring rain and snow to the region.  Here is one model depiction showing a band of rain and snow swinging through late Tuesday into Wednesday.  Green is where the model forecasts rain, blue is snow, and the darker the shading the heavier the precipitation rate. As cooler air moves into the region, most of the precipitation is progged to fall as snow on Wednesday.

12z NAM Nest forecast of precipitation type 5 AM PDT Tuesday - 5 PM PDT Wednesday (Oct 24-25) 

Of course this is just one model solution.  And for the valleys, part of the challenge with this storm is temperatures.  Given it is early season, the ground temperatures are warmer compared to a typical winter storm.  This makes the snow amount forecast extra tricky for many of our towns.  With air temperatures near or above freezing for many lowlands during the bulk of the event, snow for a portion of the event may mix with rain, or fall as a wet non-accumulating snow.

To help illustrate this, here is the chances for freezing temperatures for 8 AM, 2 PM, and 8 PM on Wednesday according to the National Weather Service's National Blend of Model (NBM).  And then finally 8 AM Thursday is shown.  Orange and and yellow shading is where chances are highest.

8 AM Wed chance of 32F or colder temperature

NBM (National Blend of Model) percent chance of 32F or colder 8 AM Wed (Oct 25th)

So Wednesday morning, the best chances for freezing temperatures are elevation dependent with the best chances north of I-90 except the lowest elevations along the Okanogan and Columbia Rivers. There is also a good chance of freezing temperatures around the Spokane and Coeur d'Alene areas (especially higher hills).

2 PM Wed chance of 32F or colder temperature

NBM (National Blend of Model) percent chance of 32F or colder 2 PM Wed (Oct 25th)

By this time, the chance of freezing temperatures is mainly in the mountains, as well as part of the Highway 2 corridor from Waterville to Davenport, as well as around the Sandpoint area.  Thus for most of the lowlands snow that falls Wednesday afternoon may have a harder time accumulating.

8 PM Wed chance of 32F or colder temperature

NBM (National Blend of Model) percent chance of 32F or colder 8 PM Wed (Oct 25th)

By 8 PM Wednesday, chance of freezing temperatures expand over much of the region, except for lower elevations south of I-90.  But by 8 AM Thursday, nearly all of the Inland NW is expecting freezing temperatures except for possibly the Lewiston area.

8 AM Thu chance of 32F or colder temperature

NBM (National Blend of Model) percent chance of 32F or colder 8 AM Thu (Oct 26th)


An ensemble system which incorporates multiple forecast model solutions gives forecasters a better idea of confidence in snow amounts.  Here is an animation of various snow amounts being reached over the region.

***Updated 8 AM PDT Oct 24th***


For the latest maps, please head to https://www.weather.gov/otx/winter

There is concern for area with fall foliage that any areas that receive moderate to heavy amounts of wet snow could bring down tree branches with local power outages.


Next hazard: Widespread hard freeze

This system will usher in much colder temperatures this week, with widespread freezing temperatures.  For those that still have tomatoes or other plants that are still thriving, time to take action!  Have you winterized your outdoor irrigation?  Also it's time to take action!  Here is a look at the forecast temperatures this week


As the graphic states, also protect livestock and pets and dress warmly if heading outdoors.  Get those gloves and winter coats ready!  Big changes are coming this week.


Monday, September 11, 2023

Will Strong El Niño Impact Our Fall Weather?

 As some of you may have heard, El Niño is developing in the Central and Eastern Equatorial Pacific Ocean.  Here is a look at the latest Sea Surface Temperature Anomalies, showing the area of warmer than normal water along the Equator.

Sea Surface Temperature Anomalies (degrees C) averaged from Aug 6th-Sept 2nd, 2023

If these anomalies persisted into the winter, we would be looking at a strong El Niño event.  The Climate Prediction Center is calling for greater than a 60% chance of a strong event.  So with the water already so warm, does this mean we can expect an impact from El Niño this fall?  Great question.

We went back to take a look at previous events in October and November since 1980 where we were already in a Strong El Niño, or heading into one for the upcoming winter.  

Let's start with temperature.

Previous Strong El Niño Events - October and November Temperature Anomalies

There have been 5 cases since 1980 of this scenario, with the closest matches being 1982, 1997, and 2015 where we were already in a moderate or strong El Niño at this point.  Green and blue colors mean cooler than normal, while yellow, orange, and reds warmer than normal.  As you can see quite a bit of variability with even some cooler than normal fall's.  

You may be asking with climate change, should we put more weight into the most recent event (2015) which was warm?  Are we seeing warmer October's and November's with time?  Let's look at a couple climate divisions over the region to see if there is a trend.

Northeast Washington October-November Average Temperature Trend


East Slopes of the Cascades October-November Average Temperature Trend


As we can see, there is a little to no trend in temperatures for October and November.  

So past strong El Niño events as well as long term trends are not telling us much about how this October and November will play out.  What other sources do we have?  The climate models are favoring a warmer than normal October and November according to the NMME (National Multi Model Ensemble).


NMME Temperature Anomaly forecast for October 2023

NMME Temperature Anomaly forecast for November 2023

What is the official outlook calling for from the Climate Prediction Center?  Some tilting of the odds towards warmer than normal conditions from October-December (Note: 2 month outlooks are not produced).


Climate Prediction Center Temperature Forecast for October-December 2023, issued August 17th

Conclusion for Oct-Nov Temps: While previous strong El Niño events as well as trends are not telling us much, the odds are tilted towards warmer than normal conditions.

What about precipitation this fall?  Again we will begin with previous strong El Niño events to see what has happened in the past.


Previous Strong El Nino Events - October and November Precipitation Anomalies


Precipitation shows less variability when compared to the temperature maps, with all five events giving us near normal amounts with minor location variability. What about long term trends in precipitation?

Northeast Washington October-November Average Precipitation Trend

East Slopes of the Cascades October-November Average Precipitation Trend


Similar to temperature, little to no trend.

What are the climate models showing?  Here again is the NMME for October and November.

NMME Precipitation Anomaly forecast for October 2023

NMME Precipitation Anomaly forecast for November 2023

There is a weak signal towards drier than normal conditions, especially in October.

Finally, what is the Climate Prediction Center calling for?

Climate Prediction Center Precipitation Forecast for October-December 2023, issued August 17th


Some tilt in the odds towards drier than normal conditions.

Conclusion: While previous Strong El Niño events have generally brought normal precipitation for October and November, the outlook shows odds slightly tilted towards drier than normal conditions.

Now that we have finally made it through November in this blog, what about the winter?  Well that is a topic for a later blog post.  But here is a little teaser...typically our El Niño winters are mild.


Monday, August 14, 2023

Heat, Fire and Smoke, Wind, Then Rain?

The hottest temperatures of the summer are imminent, with most towns reaching the triple digits.  How long will it last?  And what weather concerns will we face as we transition away from the heat?  Is there any rain in sight?  In this blog we will address these questions.

First let's take a brief look at the weather pattern causing the heat.

00z/Aug 14th Grand Ensemble forecast of 500 mb heights and temperatures valid 5 AM PDT Aug 14th

As you can see from the map, a large area of high pressure encompassing Washington, Oregon, and Idaho.  It looks like this ridge will stick around for several days, giving the Inland NW an extended period of hot weather.   But if you are not a fan of hot weather relief is in sight.  The weather pattern will shift this weekend, as indicated by the forecast weather pattern for Saturday shown below.

00z/Aug 14th Grand Ensemble forecast of 500 mb heights and temperatures valid 11 AM PDT Aug 19th


High pressure shifts into the central part of the US with a broad trough along the coast extending into the Inland NW.  

The forecast temperatures reflect these trends, going from triple digit heat this week down into the 70s and 80s by early next week.

NWS High Temperature Forecast issued 230 PM August 14th valid Aug 15-21th, 2023

How do these temperatures compare to the June 2021 record heat wave?  Not even close when several locations went above 110F, including 120F in Hanford, WA.

Map of high temperatures from June 29th, 2021

The nights of mid-August are also longer compared to those of late June.  But that doesn't mean this heat wave should be taken lightly, as Excessive Heat Warnings and Heat Advisories are out for the region.


NWS Heat Warnings and Advisories as of noon, August 14th


Some daily record high temperature records will be in jeopardy as well.  Be sure to stay safe in the heat including:
  • Wear sunscreen
  • Drink plenty of water
  • Avoid alcohol/caffeine
  • Wear a hat and sunglasses
  • Wear light clothing
  • Find shade and take breaks
  • Cool off in air conditioning when possible

Fire Weather Concerns This Week

Looking at satellite imagery Monday afternoon showed several active wildfires producing smoke across Oregon and southern British Columbia, with a few fires also over Washington, Idaho, and NW Montana.  

Aug 14th (1256-231 PM PDT) Satellite Imagery showing several smoke plumes around the region.


The hot and dry weather will likely yield increased smoke production from area wildfires over the next couple days.  

The second concern is the wind.  Typically in weather transitions with falling temperatures, the result is wind and this week is no different.  The peak of the fire weather concerns currently looks to fall on Thursday as breezy west to southwest winds develop.  Here is the forecast wind gusts for the region for the late afternoon.


While these winds may not seem too noteworthy, when combined with the hot and dry conditions yields a critical fire weather combination.  The HDWI (Hot Dry Windy Index) is showing very high chances of reaching or exceeding the 90th percentile (which means top 10% of hot/dry/windy combination).  This means that 1 of at least every 10 days doesn't see conditions this extreme.

Probability of Hot, Dry, Windy Index exceeding 90th percentile

Thus Thursday has the potential for rapid fire spread with any new or existing fires.  Please use extra caution!

Outlook for Next Week

Not only will the trough next week bring cooler temperatures, models are showing a favorable setup for some precipitation as well.  The latest 6-10 temperature and precipitation outlooks favor normal temperatures and elevated odds of above normal precipitation

Climate Prediction Center 6-10 day temperature and precipitation outlook issued Aug 14th, 2023 valid Aug 20-24th, 2023


Saturday, May 13, 2023

Strange, Odd Weather Pattern

The Inland NW is currently heading into a strange weather pattern.  There are several aspects that makes the upcoming pattern unusual, and odd.  Let's start with a look at what is going on out there from 22,236 miles above the Earth's surface.

Below is Water Vapor Satellite Imagery, which is a measure of moisture in the atmosphere.  Currently there are dark reds over Washington, most of Oregon, and north Idaho which means very little moisture out there.   

GOES 18 Low Level Water Vapor Channel 230-520 PM PDT May 13th, 2023

Also of note is a low spinning over Nevada and Utah.  That is so far away, typically not something we need to worry much about.  More on that later.

We now turn out attention to Canada.  Why Canada?  The forecast high pressure over the country is very noteworthy, and shown to be highly anomalous in the red shaded area.  The graphic below compared the model forecasts to all other forecasts for this time of year from 2000-2019.  Anything in red means the forecast is for something stronger than what has ever been forecast by the model in that 20 year period.

NAEFS Mean Geopotential Height (500 mb) and Return Interval.  Dark Red means values fall outside those that have been forecast by the model between 2000-2019.  

In fact, the strength of the ridge will play a role in the track of the low over Utah and Nevada!  We will get to that in few minutes, but let's take a quick detour to talk about what is going on in Canada.  What is going on under this anomalous high pressure?  Very warm temperatures which are aggravating wildfires in the country.

Here is today's wildfire map showing several active wildfires.

Map of current fires over western Canada and the Northwest US

Here is a link to the above map.  Orange fire icons means the fire is over 1,000 acres.  Note most of the local fires are from prescribed burns.

Under this warm ridge, temperatures are abnormally warm in Canada with many areas in the upper 70s to mid 80s, which is comparable to many readings we are seeing locally.

Map of 5 PM Temperatures May 13th, 2023


NESDIS recently released a two-minute video recapping the Canadian wildfires through May 11th which have burned around a million acres.

With the strong high pressure and warm temperatures over Canada, we will probably be seeing more stories related to the Canadian wildfires in the coming weeks unfortunately.

Alright back to our region.  How will the big high pressure over Canada and the low over Nevada and Utah influence us?  We now turn to model forecasts which are in good agreement showing a strange scenario playing out over the next four days. 

18z GFS forecast of 500mb heights and 700-500mb Relative Humidity through Friday, May 19th 2023.


The low initially moves from east to west (opposite of what typically happens), due to the very strong high pressure over Canada that takes on a west-east orientation forcing the low to track west.  Then it lifts north into Washington and Oregon on the back side of the high pressure.  Strange.

Given the trajectory of this low from the south, there will be an increased "mugginess" to the air as moisture increases over the region while our temperatures are still well above normal.  Here is a look at available moisture in the atmosphere from one model depiction.  The dark green means there will be plenty of moisture in the atmosphere come Monday, Tuesday, Wednesday, and Thursday.

Precipitable Water Standardized Anomaly from 18z GFS Model valid May 14-19th, 2023


What will this equate to weather wise?  A chance of thunderstorms each day Monday through at least Thursday.  Below is Tuesday's chance of thunderstorms per the NBM Model.  It's showing a 40-50% chance over the mountains, northern Washington, the Idaho Panhandle, and Lewiston area.  Over the Columbia Basin a 10-20% chance.

NBM (National Blend of Models) forecast of thunderstorm chances on 11 AM - 11 PM PDT Tuesday

What are the main hazards from these storms?  For that let's look at the forecast conditions of the atmosphere on Tuesday.

18z GFS Forecast Sounding for Spokane, WA on Tuesday, May 16th at 5 PM PDT

The red circled area has caught our attention.  Winds are rather weak (15 MPH or less) through a very deep layer of the atmosphere.  This means storms will be slow moving, and capable of producing brief very heavy rainfall, or flash flooding.  Stay tuned for updates as this strange and odd weather pattern plays out in the coming days.