Sunday, April 23, 2023

Significant Warming This Week

***Updated Apr 24th with new forecast numbers*** 

Are you ready for warmer temperatures?  A big change in the weather pattern is coming, bringing the warmest temperatures of 2023 so far for many locations.  First lets take a quick peak of what has been going on this spring, and why it has been so cold.

Most days this spring have brought below normal temperatures. Below is a plot of temperatures in Spokane and Wenatchee since March 1st.  The blue bars are observed values, with the brown shaded area normal values.  As you can see, most days have been cooler than normal, with observed temperatures the past 30 days showing little in the way of warming despite the normal temperatures increasing.

Spokane (GEG) temperatures since March 1st.  Blue bars are observed.  Brown shading is the normal range.  Top red line is record high values, while bottom blue line is record low values.

Wenatchee (EAT) temperatures since March 1st.  Blue bars are observed.  Brown shading is the normal range.  Top red line is record high values, while bottom blue line is record low values.

Why has it been so cold? There has been a persistent trough over the region as noted by the dark purple shading on the map below over the Pacific Northwest.

500mb temperature anomaly March 1st-April 19th, 2023

Significant changes are in the forecast.  Here is a loop showing the weather pattern this week, with strong high pressure forecast to build over the western US, which will bring the warmest temperatures of 2023 so far.

Forecast weather pattern this week - showing 500 mb heights and anomaly through April 30th, 2023

How confident are we in the warming trend?  For this answer our forecasters like to look at what are called "Box and Whisker Plots".  This sophisticated method takes in what are called ensemble forecasts.  Approximately 100 forecasts from various model ensemble forecasts compose these forecasts, giving forecasters an idea of the range in possible outcomes.  Small boxes means generally higher confidence in the forecast due to a smaller range in values, while a wider range means less confidence.  So what are the models showing for forecast temperatures this week for Spokane?

***Updated Apr 24th*** GFS, ECMWF, and Canadian Models Box and Whisker Forecast for temperatures for Spokane, WA through May 2nd, 2023

The red boxes represent the high temperature forecast, with the boxes staying fairly small through Saturday, with high temperatures warming into the 70s.  By next Sunday and especially Monday the boxes increase in size, leading to more possible outcomes and thus less confidence. You may be wondering what the vertical gray lines mean.  These are the "whiskers" and represent the model solutions that are more extreme (both warm and cold) but are still important information for forecasters to consider.

But we have taken things even a step further.  All the temperature forecast above are straight from the models, and have not gone through any sort of calibration.  Why is this important?  It's possible a model can have a persistent bias towards being too warm or too cold, which is important to try and alleviate.  This is where the NWS relatively new set of forecasts come into play.  Below is the calibrated version from the NWS NBM (National Blend of Models).

***Updated Apr 24th*** National Blend of Models (NBM) Box and Whisker Forecast for temperatures for Spokane, WA through May 3rd, 2023

This pretty much says the same story, just with slightly different numbers and ranges.  Increased box size later in the weekend into early next week means there is increased uncertainty out that far into the forecast.

Some may be saying "This is too complex, just tell me what the temperatures are going to be!"  Well we can do that, but it's always good to have some background information into the forecast so you know how confident we are.  Here is our forecast as of Sunday morning for the upcoming week.


***Updated*** NWS Official Forecast Temperatures issued 3 AM PDT Monday, April 24th, 2023

The warmest temperatures of 2023 for many locations are forecast this week.  How long will it last?  This is unknown with a lot of model variability heading into next week.  For the latest forecast, head to https://www.weather.gov/spokane

Saturday, April 8, 2023

Heavy precipitation expected, but will we see flooding?

Warm and wet weather is coming to the Inland Northwest. But how wet is it going to be and will the resultant precipitation result in widespread flooding? This can be answered by looking at a few things, including precipitation amounts, snow melt, and antecedent conditions. We will start by discussing the precipitation. 

PRECIPITATION: The latest official forecast for Spokane is calling for 0.97" of rain over 48 hours starting 11 AM Sunday and lasting through 11 AM Tuesday. Spokane won't be the only area receiving significant rainfall, but much of the Inland Northwest will as well. This rainfall is coming from an unusually strong atmospheric river for this time of year. In fact, we could set a daily record for precipitable water values (total amount of moisture in the atmosphere) on Monday. 


Atmospheric River forecast

This event places just below the top 10 wettest (12th wettest) 48 hour stretches for Spokane (records back to 1881) in April. If 1.00" of precipitation were to occur this from Sunday morning through Tuesday morning in Spokane, the monthly total precipitation so far (1.33") would exceed the average April total (1.12") within the first 11 days. That would place the April 2023 total precipitation in the top 33% of all years by the 11th. It would also be the wettest 48 hour period the Spokane area has seen since May 20, 2020. 
Probabilistic data from our weather models are useful to predict the chance of 1.00" of rain over 48 hours in Spokane early this week. The current odds of exceeding this total in 48 hours is 16% so we are forecasting on the wetter end compared to the weather models. 12 hours ago, the weather models were indicating only an 8% chance so the newer runs of the weather models have doubled the odds of greater than 1 inch or rain.


Another way that we communicate forecast uncertainty is through using a range of possibilities such as a low end amount (90% chance that there will be more rain than what is forecasted) or a high end amount (10% chance of there will be more rain than what is forecasted). The first graphic below represents the low end amount for Spokane with this event. The second graphic represents the high end amount for Spokane. Given our official forecast is calling for 0.97 inches of rain, we are forecasting on the wetter side of the model possibilities. To follow the latest official forecast, please visit www.weather.gov/spokane.

Low End Amount (90% chance of exceeding 0.3" of rain)

High End Amount (10% chance of exceeding 1.13" of rain)

SNOWMELT: The other piece of the puzzle is what what will happen to the existing snowpack? Will we melt a considerable amount of it, adding to the precipitation runoff, or will it stick around for a while? Although this might sound like an easy question the answer, it is more nuanced than you might think. Even if the temperatures get well above freezing, that doesn't necessarily mean the snow will instantly melt and runoff into the rivers. First off we need to warm the snowpack temperatures to freezing. This animation below shows the snow pack temperatures over the past week. Red colors show the snowpack temperatures around freezing and primed for melting. Notice the rapid expansion of the red over the past week over the northern third of eastern Washington, especially in the valleys below 3000-3500'.   


This suggests the snow will melt off quickly in the northern valleys especially considering we are going to see temperatures well above freezing from tonight through Tuesday night. However, even the snow is going to melt, that doesn't necessarily translate to it running off since it can be soaked up by the existing snowpack. How can we determine if that's going to happen? To determine if the snowmelt is going to runoff we utilize something called snow density which is the ratio of the snow depth to the amount of water in the snowpack or snow water equivalent. For snowmelt to effectively runoff we want to see snow densities of  50% or greater. 

If you look closely at this map below most of the values are well below 50%. But the problem with this map is most if not all the values in the Inland Northwest are in the mountains above 3500' and don't tell us about the density of the lower elevation snow however we can be certain the snow ratios are higher than what's seen on this map. Consequently we'd expect to see a good amount of the low level snow melting off into the nearby rivers over northeast and north-central Washington and north Idaho.  But will that necessarily lead to flooding? 

Snow density values as of 4/8/2023


ANTECEDENT CONDITIONS: To help answer if we expect to see flooding, we can look at the antecedent conditions, or in other terms what's going on with the current river levels or soil moisture. Much of that can be determined by how much precipitation we've seen recently combined with how much snow melt we've seen. Over the past 3 months it has been exceedingly dry over the Inland Northwest, especially over north Idaho and extreme eastern Washington where some precipitation amounts are around half of normal. 

90 day percent of normal precipitation

Despite the dearth of precipitation, the much cooler than normal weather has resulted in a relatively normal snow water equivalent for this time of year. But it's a far cry from what most of the Western US has experienced this winter (widespread dark blue)

Snow Water Equivalent for 4/8/2023

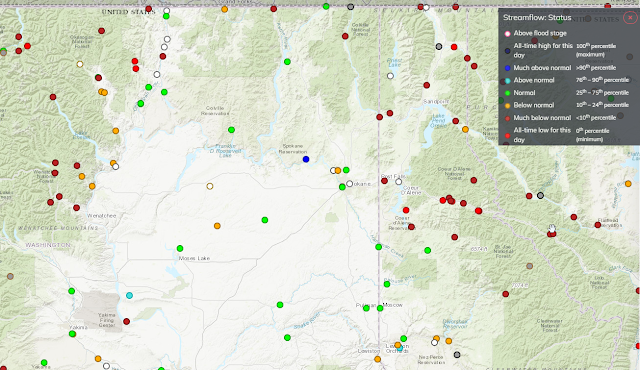
So what do you get when you have lighter than normal precipitation and a relatively normal snowpack? This means there hasn't been a significant amount of runoff into the rivers. So how light has the runoff been this Spring? Extremely light is the answer! Check out this map below for the specifics. 

Steamflow vs normal for 4/8/2023

Notice all the red dots clustered over north Idaho into portions of northeast and north-central Washington. The dark red dots show locations that are much below normal for this time of year (10th percentile), and the bright red dots correspond to locations that are at their lowest level for the current date. These record and near record low spots include much of the Coeur d'Alene, St. Joe and Pend Oreille Basin in north Idaho and the Spokane (hidden by green dot over Hangman Creek), Okanogan, and Kettle River Basins in eastern Washington. 
For the Coeur d'Alene River, near Cataldo, it is at its lowest level for the date in the past 88 years! 

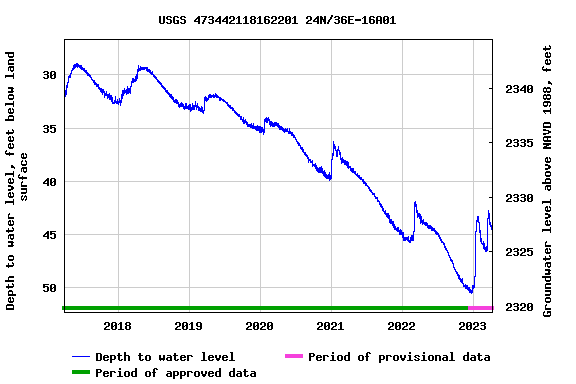
If we want to examine current ground water conditions, across the Columbia Basin there is a well sensor located just southwest of Davenport. Long term drought conditions have resulted in a steady drop in the water table since 2017. In fact at the beginning of the year the water table was roughly 50' below ground and the lowest this well has seen since 1992. 
Well Water Table southwest of Davenport, WA


THE FINAL VERDICT: So adding all this information up, what does this tell us? It tells us we have a lot of room in the rivers and groundwater to accommodate this upcoming rain and snow melt event.  So at this point we expect this to be a largely beneficial event rather than one with destructive flooding. That's not to say there won't be any minor ponding of water in low-lying areas, but we don't expect to see any major flooding at this time. Stay tuned for updates and monitor our latest forecasts for details.