The calendar may say it's October but the weather this month has felt far from it.
And while wildfire smoke is common in August and September, having so much of it this late into October is unusual. Here is the air quality map as of 5 am this morning.
 |
| 5 AM Oct 20th Air Quality readings |
Very unhealthy and even hazardous air around Seattle, and Lake Wenatchee. For the latest readings head to fire.airnow.gov. West winds today may bring some of the Seattle smoke into parts of Eastern Washington but a stronger weather system on Friday will clear much of the smoke out.
Want proof of how unusual this is so late in the year? Below is a tile plot courtesy of EPA showing average daily AQI values for Wenatchee, WA since 2005.
 |
| Average Air Quality values for Wenatchee, WA since 2005 |
The bottom row in the chart is this year, where unhealthy air (red colors) is still evident and the latest it has stuck around since 2005. Those in Wenatchee may remember the 2012 episode which also did carry on through October 11th. Data for this site along with many others can be found here.
The dry conditions over the past 4 months have been quite noteworthy as the percent of normal precipitation map below shows.
The driest areas relative to normal are where many of the active wildfires continue to burn (Cascades, far NE Washington, and the North Idaho Panhandle).
And then there is this month where max temperatures have been running well above normal. Several cities have set a record for the number of 70+ degree days for the month of October. High temperatures have been running 10-15 degrees above normal, and approaching 20 degrees above normal in the Washington Cascades.
 |
| Max Temperature Anomaly (degrees F) Oct 1st-Oct 18th, 2022 |
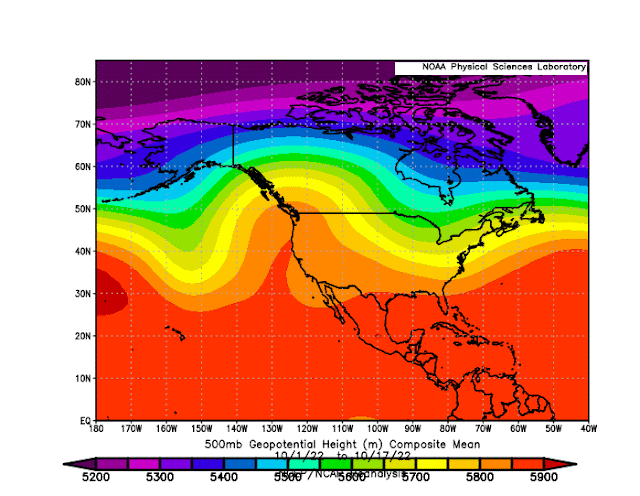
And the month thus far has been very dry. The reason is a persistent ridge of high pressure over the area.
 |
| 500mb height anomaly Oct 1-17th, 2022 |
Ok enough talk about the smoke and dry weather, what about the big change for the upcoming weather pattern? The stubborn ridge is going to move west, allowing a much cooler weather pattern to settle in. Here is one model depiction of the change. The loop starts with yesterday (Oct 19th) and goes out through Oct 26th. You will notice a shift in the high pressure to the west allowing a series of cool weather systems to drop in from the northwest.
 |
| GEFS model of 500mb heights and anomalies Oct 19-26, 2022 |
What do the surface temperature anomalies look like with this pattern shift? Going from a large area of warming over western North America to cooling.
 |
| GEFS model of 2 meter temperature anomalies at 5 PM PDT each day Oct 19-26, 2022 |
This cool and wet pattern will surely give the mountains their first snow of the year. And with multiple systems the snow may pile up over the Cascades, the Rockies, and portions of the ID Panhandle. Of course precise amounts several days out may change, but here is what one modeling system is showing through October 26th.
 |
| NBM forecast snow amounts Oct 20-26, 2022 |
Overall this change in the pattern is more typical of La Nina.
La Nina winters tend to favor cooler and wetter than normal conditions. Of course this is never a guarantee, as other variables can influence the weather patterns at times.
La Nina tends to favor above average snow especially along the Cascade crest, Palouse, and Lewiston area. A map showing La Nina Snow Climatology from 1950-2017 can be found below.
 |
| Percent of normal snowfall average for La Nina winters 1950-2017 |
An interactive version can be found at this link.
And hot off the press, here is the updated CPC Winter Outlook released this morning.
 |
| Climate Prediction Center December-February Temperature Outlook issued Oct 20th, 2022 |
 |
| Climate Prediction Center December-February Precipitation Outlook issued Oct 20th, 2022 |
No surprises with these outlooks given the forecast La Nina.
Say goodbye to the smoke as a major change in the weather pattern is imminent!

