Thursday, June 16, 2016

Warm April temperatures and what that meant for our snow pack

This past April, most locations in the Inland Northwest saw above average temperatures and near record breaking high temperatures. April of 2016 was the second warmest April on record, falling just short of April 1934. The average temperature that is normally seen in Spokane in April is 47.7°F.  This past April reached an average of a 54.7°F, a whopping 7°F above normal.  

Below are the charts from the Climate Prediction Center (CPC) with their outlook of what they thought April would look like (on left) and on the right, what actually happened. They were not too far off on their predicted temperatures in the Pacific Northwest. The entire region recorded much above average and a few locations, such as the Palouse and northwest Montana, reached record breaking April temperatures. 


CPC's temperature prediction vs. the obvserved average temperature for April 2016


The graph below shows the temperature range that was observed (blue bars) at Spokane for the entire month of April, and how that compares with both the normal temperature range and the record highs and lows. The brown strip in the middle shows the normal temperature range while the pink above shows the record high temperature and the light blue on the bottom shows the record minimum temperature. 


We can see that Spokane's high temperature was above normal for 22 days, while there were only 3 days when the temperature was below normal. Record high temperatures were reached on April 8th, 19th, and 20th.  
April 2016 temperatures at Spokane


Lewiston also experienced many days in which the temperature was above average. There were 16 days when the high temperature was above average. Although that is not as many days as Spokane saw, that was still over half of the month with above average temperatures. On the opposite end of the spectrum, there were only 2 days when the minimum temperature was below average.  
April 2016 temperatures at Lewiston


Wenatchee also experienced a similar trend with 23 days exceeding the average high temperature and 6 of those days that broke max temperature records. Of the three cities we are looking at, Wenatchee had only one day on which the minimum temperature was below average. 
April 2016 temperatures at Wenatchee


As previously mentioned, there were multiple days when the high temperature record was broken. The map below shows the locations where records were broken in Washington. For many of these locations, there were multiple days where the record was broken or tied. We can see below that there were 254 broken records and 49 that were tied. 
Locations where the highest max temperature was broken within the month of April

Not only were there record highs, but there were also records for the warmest minimum temperature. This means that the low temperature for nights in April were the the warmest night temperatures that many locations have ever seen. There were 190 records throughout Washington State where the highest minimums were recorded and 57 records that ties the previous.
Locations where the warmest minimum temperature was broken within the month of April


Now that we have talked about the record breaking temperatures that were seen across the Inland Northwest, lets see how that affected the snow pack on the mountains. 

There is one thing that should be clarified before we go into too much depth with the next few maps. There are many automated observations in the mountains operated by the Natural Resources Conservation Service (NRCS).  These are called SNOTELs (SNOw TELemetry) and they collect hourly information that is then transmitted to the NRCS. There are over 730 SNOTEL's that stretch over 11 states, typically in the mountains where access is either limited or restricted. In addition to measuring the depth of the snow, SNOTELs also measure snow water equivalent (SWE), which is simply the depth of water that would cover the ground if the snow cover was in a liquid state. 


One of the sensors that is on the part of the SNOTEL is something called a snow pillow. Snow pillows are "envelopes of stainless steel or synthetic rubber, about 4 feet square, containing an antifreeze solution" (NRCS). When pressure is applied to the snow pillow, an electrical reading is obtained and the data is transmitted to the NRCS.  The snow pillow essentially measures the weight of the snow that it on it.  The weight of the snow is then converted to how many inches of snow water equivalent is in the snow.  A foot of dry fluffy snow will have a  lot less water in it than a few inches of old, slushy snow.

SNOTEL


In order to find out how much snow melted in April, NRCS took the observed SWE on May 1st and subtracted the observed SWE from April 1st. The red dots indicate the locations where more snow melted in the month of April than any other April in previous years. The orange dots that are on the map represent the second highest recorded snow melt amount for April.  In other words, many of the SNOTELs in the Northwest saw their fastest April snow melt on record.  But records for many of these sites only go back to the 1980s.  
Record snow melt amount in the month of April


When we compare the snow water equivalent with what was observed last year, we can see that there is a huge difference at the end of March, but by the time we get to the middle of May, we are in a similar situation as last year but not quite as extreme in some areas. 

On March 30th, 2015, most of the basins had only 30-45% of their normal SWE.  Some of the basins in western Washington had less than 10% of their normal SWE. Comparing that to March 28th of this year, we can see a huge improvement.  Most basins were near or above normal (i.e. greater than 100%).
SNOTEL Current Water Equivalent % of Normal- March 2015 and March 2016

By May 13th, 2015, the snow pack was still far below normal across Washington, Idaho, and Oregon. The SWE in the Spokane basin was only 30% of normal, along with the Idaho Panhandle and a few locations in the Cascades at 0% of normal. During the spring of 2016, the Spokane basin went from being near-normal (96%) at the end of March, to only 43% of normal by mid-May. North Central Washington, which was well above normal at the end of March (137%), plummeted to only 33% of normal by mid-May. The warm temperatures that the Pacific Northwest experienced in April took a huge toll on our snow pack.  
SNOTEL Current Water Equivalent % of Normal- May 2015 and May 2016
The last charts that we are going to look at are select SNOTELs in the area so we can compare last year’s snowpack to this year's, and how those both compare to normal. The green line indicates the normal that we would expect to see while the red is what was observed in 2015 and black is what was observed this year. For most of the locations noted below, you will see that the snow disappeared at least one month earlier than normal. 

These first two charts are from SNOTEL's in the Washington Cascades. It looked as though we were going to have a normal snow pack year (compare black line to green line).  But once the warm temperatures hit in April, the snow pack for both Blewett Pass and Lyman Lake melted rapidly.  Blewett Pass lost all of its snow by mid April while Lyman Lake still has a little snow left  Both are melting off more than a month earlier than normal.  The average day when there is snow on Blewett Pass is May 28th but this year is lost its snow by April 14th. Lyman Lake still has 11.3 inches of SWE on the ground while the average for this time is 31.2 inches of SWE. 
Western Washington SNOTEL's (Cascades)

The next two locations are located in the mountains of north-central Washington. By the time April 1 rolled around, those locations had an above normal snow pack.  But after the April heat, the SWE dropped below average. Both of these sites in north-central Washington lost their snow pack over a month earlier that normal. Moses Mountain usually loses its snow around June 11th but this year it lost it right around May 5th. Salmon Meadows typically has snow until May 28th but in 2016, its snow melted by April 21st.
Central Washington SNOTEL's

For the eastern side of Washington, Quartz Peak (Mt. Spokane) had above average snow fall during the winter.  But the snow melted off about as fast as last year. 2015 had a lot less snow on Quartz Peak yet the snow was gone within one day of each other on April 27th, 2015 and April 28th, 2016 (normal is June 19th) . Spruce Springs snow pack was below normal for almost the entire winter, and the snow that they received melted off almost a month and a half earlier than the normal. In 2016, Spruce Springs lost the near-normal snow that it received by April 20th (normal is June 11).
Eastern Washington SNOTEL's


The last locations are in the Idaho Panhandle, Lookout Pass and Mica Creek. Both sites received below average snow for 2016, but it was still double what fell in 2015. But after the April heat of 2016, the snow pack was melted away about as early as in 2015.  The last day when there is typically snow on Lookout Pass is June 27th but for 2016 it was May 7th, a month and a half early. Mica Creek was very similar to Lookout Pass with the average last day of snow being June 22nd and the snow disappearing by May 4th, 2016. 
Idaho Panhandle SNOTELS


A year ago, we were looking back at a winter that had near-normal precipitation, but very little mountain snow.  By June of 2015, the mountain snow pack was pretty much gone, with a hot dry summer yet to come.  This lack of mountain snow had numerous impacts, including agricultural irrigation limitations and warm river water temperatures for fish.

The 2015/16 winter brought above average precipitation and near-normal mountain snowfall to the region.  By the spring of 2016, things were looking very good for water supply.  But then a very warm April melted almost all of the mountain snow pack.  However, as we have shown, while the snow pack melted rapidly, the overall water supply situation is not quite as dire as it was by mid-June of 2015.

Thursday, June 9, 2016

Does Hot Spring Mean Hot Summer?

Many people are starting to ask the question "With spring being so warm, does that mean that the summer will be hot as well?" Although there is no clear answer to this question, we can look at the statistics from previous years and compare them with the how the current pattern is shaping up to get a better idea at what this coming summer might look like. 

A strong El Niño formed in the equatorial Pacific during the spring of 2015, and it persisted through the summer of 2015 and this past winter before it weakened this spring. The Climate Prediction Center has issued a La Niña watch for late summer through the winter 2016-2017 which will bring a shift to the weather in the coming months. But for now, we are going to focus our attention on what June, July, and August might look like for the Inland Northwest. 

This past spring has brought temperatures much above average and for many locations in Eastern Washington and the Idaho Panhandle, the temperatures were record breaking. The above average temperatures were not confined to only our location either. Oregon, California, Montana through most of Wyoming and parts of Utah were also either above normal or much above normal based on the mean temperature that is shown below.


Before getting into the statistics, we will compare our 2016 spring to the previous year. In 2015, Spokane, Lewiston, and Wenatchee all were much warmer than normal for the months of March, April, and May (see table below). We can see that these three locations were all  more than 5⁰F above average for the summer months of June, July and August last year.  But the springtime temperatures this year we are even warmer than last year.  Does this mean that this summer will be even hotter?

Temperatures above average along with their records (listed in parentheses) comparing 2015 to 2016 for Spokane, Lewiston, and Wenatchee

As we said, last summer we had a strong El Niño that had formed during the spring and continued through the summer.  But this year, El Niño is weakening and will be replaced by a La Niña later this autumn.  When looking at past years when our climate has changed from an El Niño pattern to La Niña pattern, we can see a common trend in what our summer might look like. 

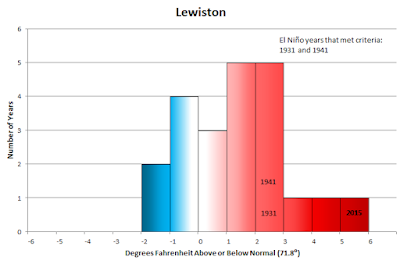
So how often does a warm Spring mean that a warm Summer will follow?  The graphs below are for years where the Spring temperature in March, April, and May was at least 2⁰F above average.  The bars show the distribution of the following Summer temperatures compared to normal.

Number of years when Spokane's spring (March, April, and May) was over 2 degrees F above average and what the summer (June, July, August) looked like following those years. 

We can see that in Spokane, there were only 4 years that occurred where the summer was cooler than average following a warm spring, while there were 17 years where the Summer temperature was above average. 


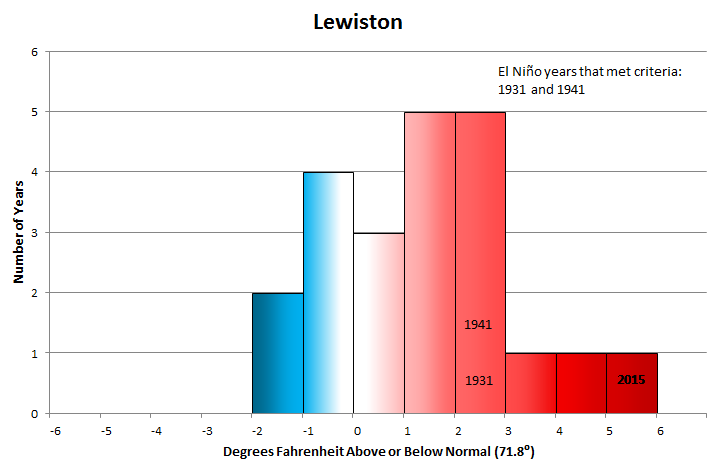
Number of years when Lewiston's spring(March, April, and May) was over 2 degrees F above average and what the summer (June, July, August) looked like following those years. 

For Lewiston, there were six years where a warm Spring was followed by a cool Summer.  The vast majority (16) of warm Springs also had warm Summers.


Number of years when Wenatchee's spring(March, April, and May) was over 2 degrees F above average and what the summer (June, July, August) looked like following those years. 
In Wenatchee, the story is about the same.There were 3 years where the summer temperature was cooler than the average following an above average spring, while there were 10 years that were warmer normal. 

The tables below show the years where there was a strong El Niño that switched to a La Niña, just like what is expected during this coming summer. For most of the years where a strong El Niño occurred during the winter months, we can see that the average temperatures for March, April, and May were above average. The average summer temperatures following those warm springs were a majority warmer than average. There were a few years, such as 1983 and 1988, where the summer was cooler than average following a warmer spring. Although 2015 was not a summer that was followed by an La Niña, it was included for purposes of comparison.

The red boxes within the table indicate a temperature that is above .5 degrees F above the average temperature for spring or summer. The blue boxes indicate that the temperature is below .5 degrees F from the average while the white boxes would be considered normal due to the fact they are +/- .5 degrees from the average. 
How the summer temperatures compared with the summer temperatures for years following a strong El Niño, excluding 2015. 2015's summer broke all records and is included to show how this year compares.

Every month the CPC (Climate Prediction Center) puts out what they expect the next 3 months to look like. The images below are what the CPC was predicting last year for the Spring and Summer. The images on the left are what they predicted and those are compared to the images on the right, which is what actually occurred during those months. We can see that for the Inland Northwest they were not too far off from what they predicted out spring and summer of 2015 to look like. 

Spring 2015


Summer 2015


So how did they do with our warm Spring this year?  The images below show that once again, the outlook from CPC was fairly accurate.

Spring 2016


And that leads us to the CPC outlook for this summer. It's not identical to last summer, as they expect warmer conditions for most of the country.  But they once again have higher confidence of a warmer-than-normal Summer for the western US.

Summer 2016


Although we cannot say directly that this coming summer is going to be hot due to the fact that spring was above average, we can say that based on statistics, there is a good chance that our summer will be warmer than normal. That does not leave out the possibility of it being a cooler summer, but the odds aren't in your favor.

Wednesday, May 25, 2016

May 21, 2016 Thunderstorm Flash Flood

North Spokane got hit by a strong thunderstorm that produced an excessive amount of rain over a short period of 45 minutes requiring a Flash Flood Warning to be put out for the Indian Trail neighborhood. The thunderstorm started to build around 2:30 pm and continued to build over the next half hour before dissipating. There were many reports of rain from as little as .69" in Spokane Valley to 2.24" in North Central Spokane with possible higher amounts that were not recorded. A gust front formed as a result of the quick development of the thunderstorm and we also noted a temperature drop of 10˚ over the Spokane area within an hour.

Storm Totals
Below is an image of the 24 Hour Rainfall Totals. The shaded areas below are estimates generated from the radar–most of the values within the shaded areas were verified by storm spotters in the area. These values may include light rainfall data that may have occurred before and after the initial storm, but it gives a rough estimate of where the majority of the rainfall took place.

Photos from around the Area
There were many photos from the public on social media and those photos have been placed on a map in the link below. There are photos from directly under the storm as well as some of the other storms that were around the area.   


Radar Image
There are 3D radar images of the storm below  that started at 2:34 pm and continue until 3:15 pm. The radar indicated where the strongest rainfall was and also where hail could possibly have fallen. There is some yellow that is visible on the map to help show the shape of the storm. The 3D imagery of the map focuses on the red portion of the radar and less on the yellow and green (the lower dBZ). The red indicates any rain that was over 50 dBZ which is considered heavy rain. We can see how the storm built along with the heavy rain in a vertical motion.    


We can see in this first imagery that the storm was starting to build above the Indian Trail area in North Spokane but showed no indication of possible heavy rainfall. However, there is a hint of yellow on the map that showed that there could possibly be moderate rainfall.
Radar image at 2:34 pm PDT


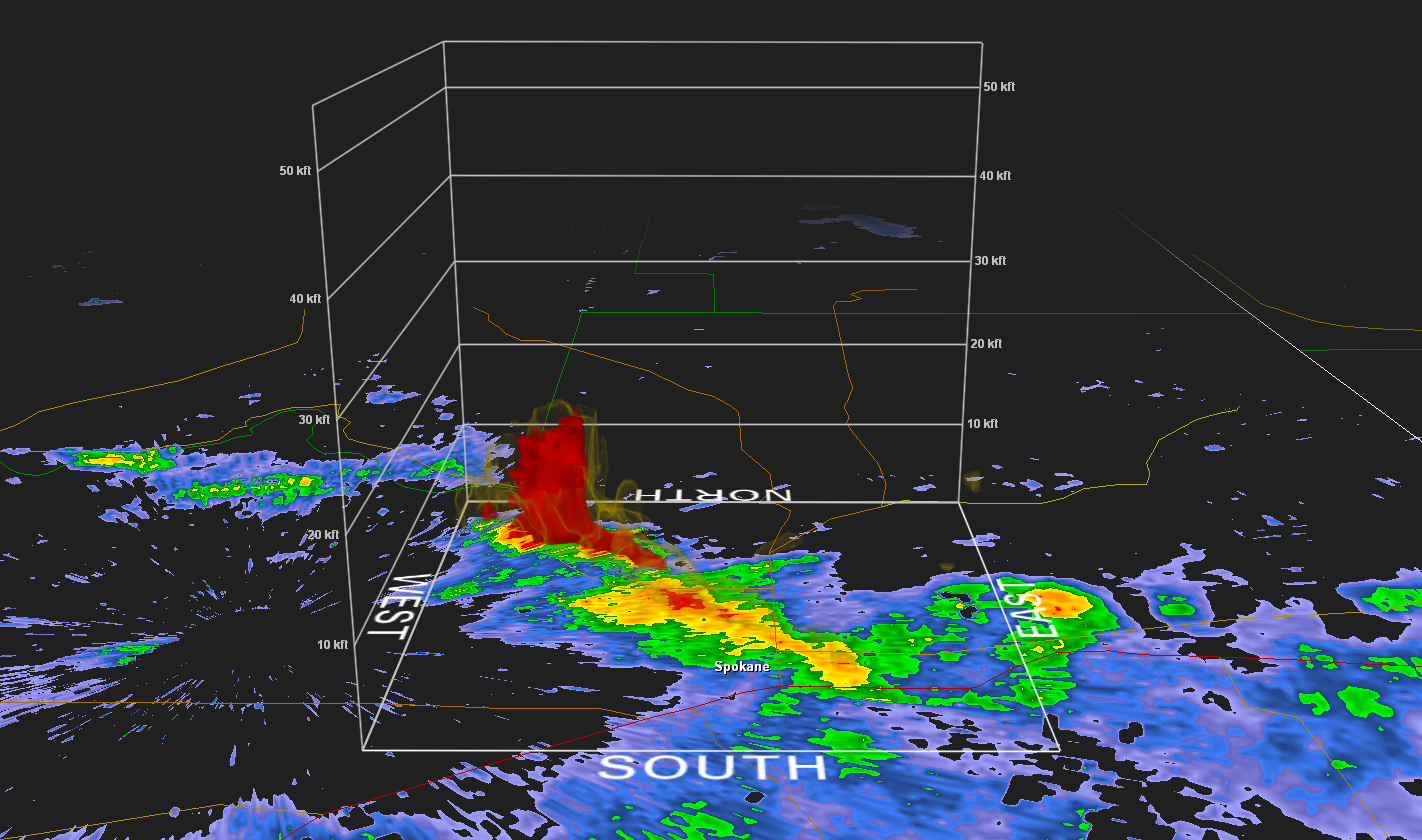
After 12 minutes passed, we can see that the storm was vertically stacked with heavy rain up to 20kft which is roughly 3.7 miles. The storm over Indian Trail was stronger than the rest of the storms in the area due to the fact that it was towering over the rest and it also was recorded with a stronger dBZ.
Radar image at 2:46 pm PDT


The heavy rain continued even at 2:52 pm, as the storm maintained heights upwards of 20kft showing no relief of the heavy rainfall. The storm that was to the south east of the strongest storm had not gained a lot of strength. 
Radar image at 2:52 pm PDT


At 3:03 we can see that the storm intensity had greatly decreased from what it was at its heaviest and was only reaching heights of 8kft (roughly 1.5 miles). Within a matter of 17 minutes, the storm had lost most of the heavy rain that was contained within it. 
Radar image at 3:03 pm PDT


The last radar image that showed the storm was at 3:15 pm. By this time we can tell that the storm was over and there was no storm building up behind it. There was little red visible on the map indicating the worst of the rain was gone.
 Radar image at 3:15 pm PDT


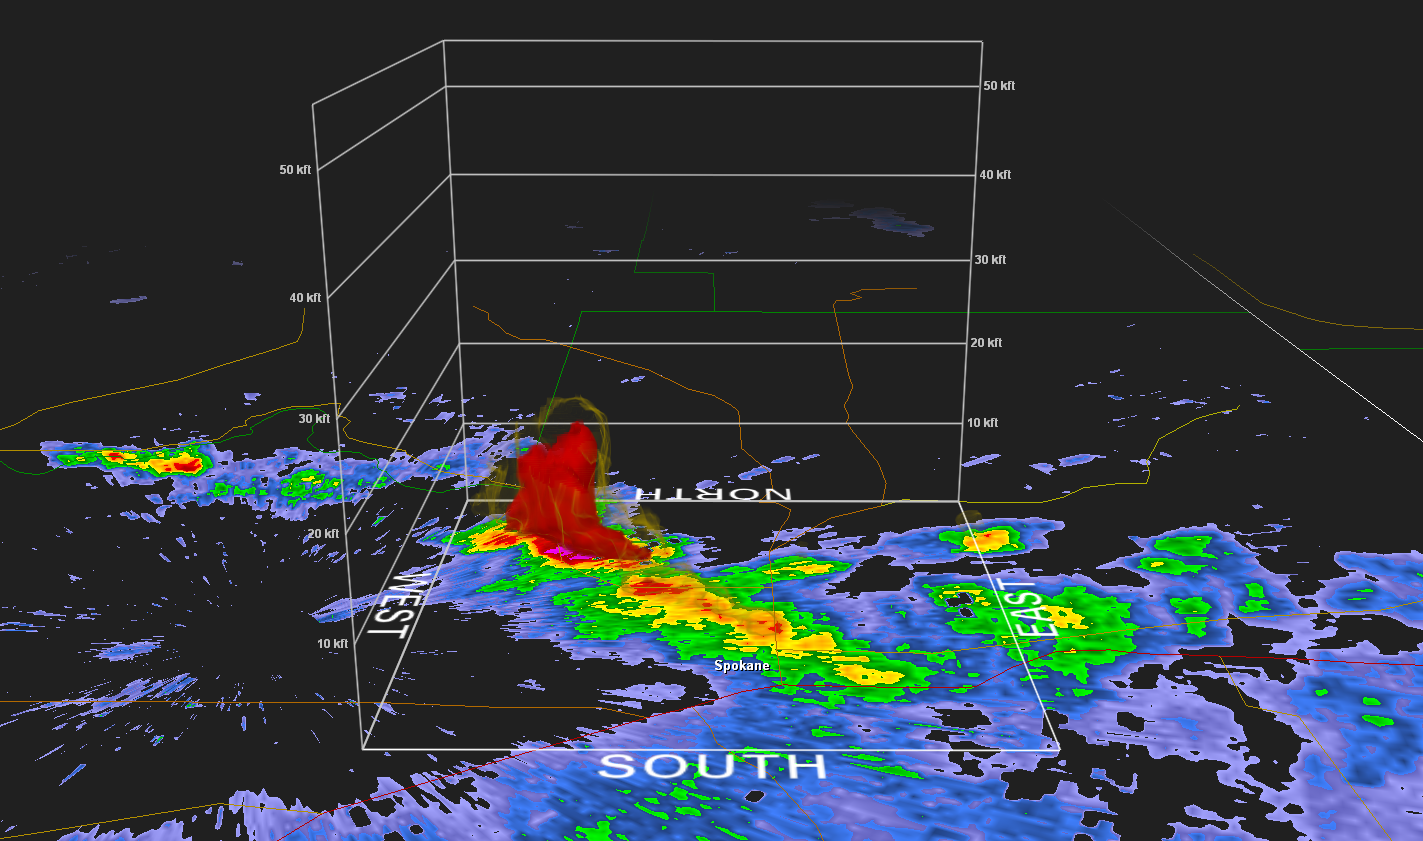
This last image shows where the location of possible hail would have fallen in the storm. The small pink area shows anything that depicts on the radar over 60 dBZ which indicates extreme rain or moderate hail.
Radar image at 2:46 pm PDT


Storm Motion
Along with the rain, there was also a gust front that was produced from the downburst that occurred. This map shows the direction the wind was moving. We can see a definite line along Highway 291 where there is green along one side and red on the other. The green shows the wind that was moving toward the radar which is labeled KOTX. The red shows the wind that was moving away from the radar. As time moved along, we can see that the gust front on the west side of the storm was moving towards the radar and away from the storm.
Wind Direction at 3:03 pm PDT

Wind Direction at 3:15 pm PDT


Monday, April 18, 2016

April heat, mountain snow melt, and thunderstorms

April is sure off to a warm start by Inland Northwest standards, with some locations off to the warmest start on record.   Will the warm weather continue?  The answer is a definite yes!   The warm weather is going to lead to significant snow melt in the mountains this week which could cause some river flooding, as well as the potential for thunderstorms for the end of the week.  Lots to discuss, so let's get into it.

First off, the warm start to April.  Here is a map showing the temperature anomalies for the first 16 days of April across the Continental US.

The pattern here is clear, much above normal temperatures over the west (about 6 degrees F Northwest), and colder than normal over the east.  The following COOP sites are reporting the warmest start to April on record:  Lind, Quincy, Plain, Stehekin, Mazama, Priest River, and Colville.  

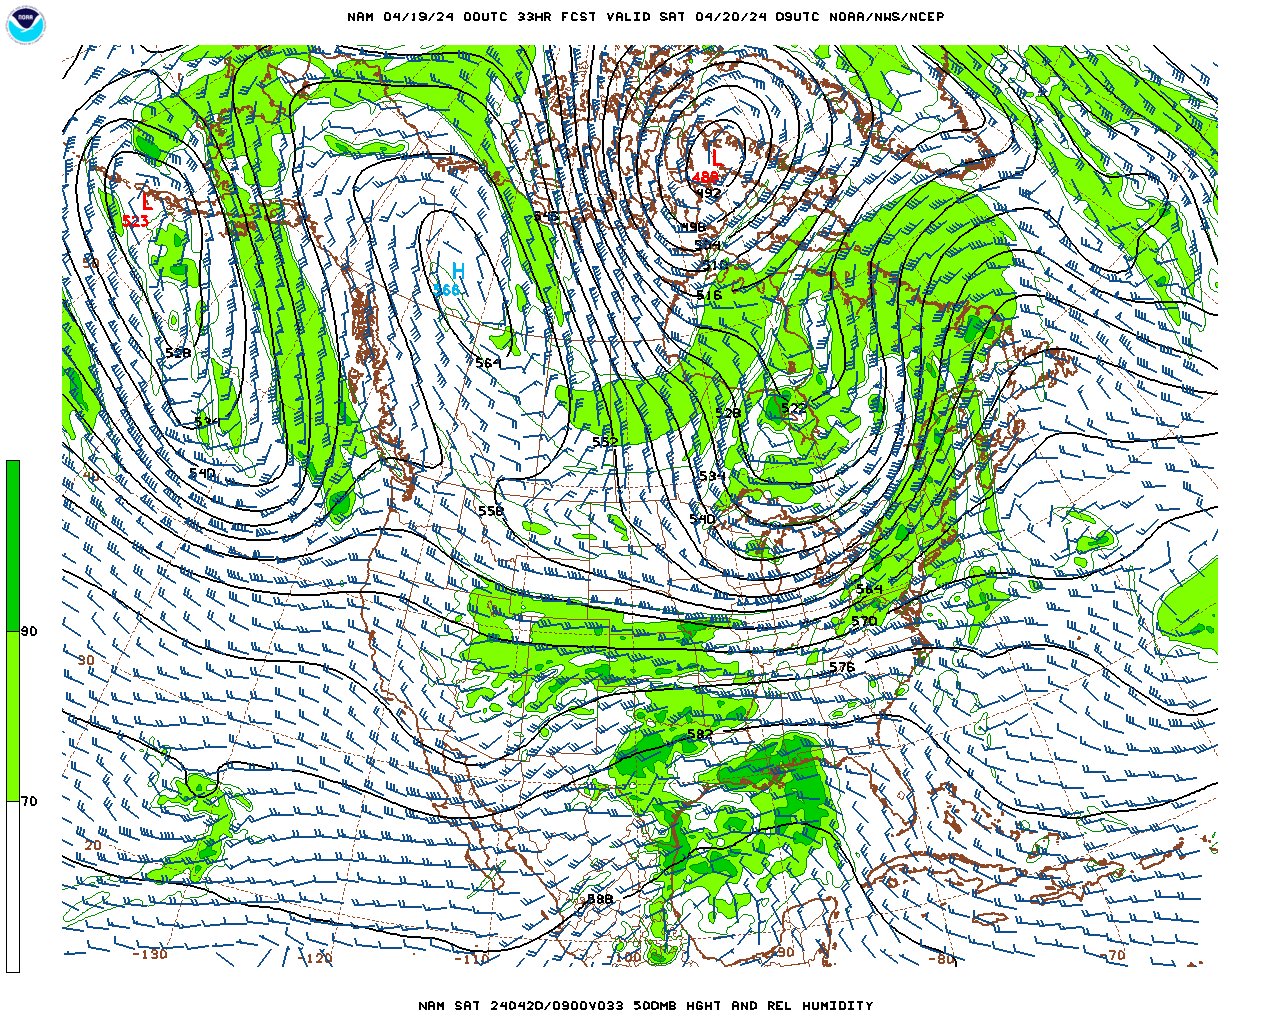
The warm weather is going to continue this week, with temperatures 15 to 25 degrees above normal through Friday. This is partly in response to high pressure centered right over the area for multiple days allowing continued warming of the air mass over the region.   This is what Meteorologists call an omega block.  Take a look at the GFS model forecast for Tuesday, do you see it?

00z/18th GFS model run forecast of the 500mb heights 18z Tuesday (11 AM PDT Tuesday)
The table below shows our current forecasts as of Monday morning for Tuesday and Wednesday for selected cities, as well as the current records for the date.


The pattern by the end of the week begins to shift.  The strong ridge moves east allowing increased moisture to be brought into the region from the south.  The increased moisture combined with the warm temperatures will increase our chances for thunderstorms.  Below is a graphic from the GFS model portraying the expected pattern for Thursday.

00z/18th GFS model run forecast of the 500mb heights 06z Friday (11 PM PDT Thursday)


It's still too early to narrow down which days and where thunderstorms will occur, and to what intensity.  However the pattern looks favorable and chances will be gradually increasing for late in the week.

The warm weather will also cause snow melt in the mountains with this water making it into area rivers.  This may lead to minor flooding on rivers along the East Slopes of the Cascades and north Idaho Panhandle.  

Here is the current situation with the snow pack across the region.


NOHRSC SWE analysis for April 18th, 2016 09z

As you can see, lots of snow pack remains in the Cascades, Rockies, and north Idaho Panhandle.  The warm weather and snow melt means rising rivers.

The Okanogan River at Tonasket is currently forecast to reach flood stage by the end of the week with several other rivers in the Cascades and north Idaho Panhandle likely to reach at least action stage. Those with interest near area rivers should monitor the latest forecasts by clicking on the link below:


So how long will this warm weather last?  Will this be the warmest April on record?  It's still a bit too early to make this call, but the near record warmth for much of this week combined with the warm start to April will sure help the cause.  There is still next week to get through, and here is the latest outlook from CPC (Climate Prediction Center)


The outlook for April 25th - May 1st calls for slightly elevated odds for warmer than normal temperatures.

In summary, expect near record warmth this week resulting in increased snow melt and rising rivers, as well as an increasing chance for thunderstorms by Thursday or Friday, 

Monday, March 21, 2016

UPDATED....Is a significant snow event possible for Spokane,Coeur d'Alene or the Palouse late tonight and tomorrow morning?

So as we talked about yesterday, an unusually tricky weather scenario looks like it will unfold over the Inland Northwest. So what are we fairly certain about? We are fairly confident that a slow moving upper-level low-pressure system will take up residence over the Inland Northwest and produce a band of moderate to locally heavy precipitation. The big questions to answer are where is this band going to set up and will it cool the atmosphere enough that we could see some significant snow. The setup producing the unusual event looks quite similar to what we discussed in our previous blog. We still expect to see strong lifting associated with a slow moving upper level low parked somewhere over eastern Washington. Notice the green shaded area (representing upper-level moisture) remains parked over eastern Washington and the central Idaho Panhandle through much of Tuesday.


500 mb pattern 2am Tue-5pm Tue
The lifting from the low will be accompanied by plenty of moisture and instability which should be perfect for producing a band of precipitation. Just how much precipitation are we talking about? A lot to say the least. The areas in purple represent totals between 0.50-1.00 inches of liquid and the reds and yellows equate to amounts between 1.00-1.50 inches. This is for the 12 hours between 2am through 2 pm Tuesday. Notice the band of heavy precipitation has eeked farther north than what we were looking at in yesterday's forecast and blog.

Latest 12 hr precipitation forecast 2am Tue-2 pm Tue

Previous 12 hr precipitation forecast for 2am Tue-2pm Tue

We still highly suspect that whatever verifies from a precipitation standpoint will more closely resemble the top two panes showing a heavy east-west oriented band vs the more poorly defined precipitation blob in the lower two panes.

Since the forecast is nearing in time we can also use one of our favorite tools called the HRRR (a rapidly updating model that runs hourly and can ingest current weather conditions). Let's see what the latest run of it says. The loop below is a simulation of what the radar is expected to look like. Green and yellow shading indicates where the heaviest precipitation is expected.

Radar simulation for Tuesday morning

So this also boosts our confidence that this event is going to occur. Each subsequent run of this model continues to show a similar radar formation (with small variations in location).

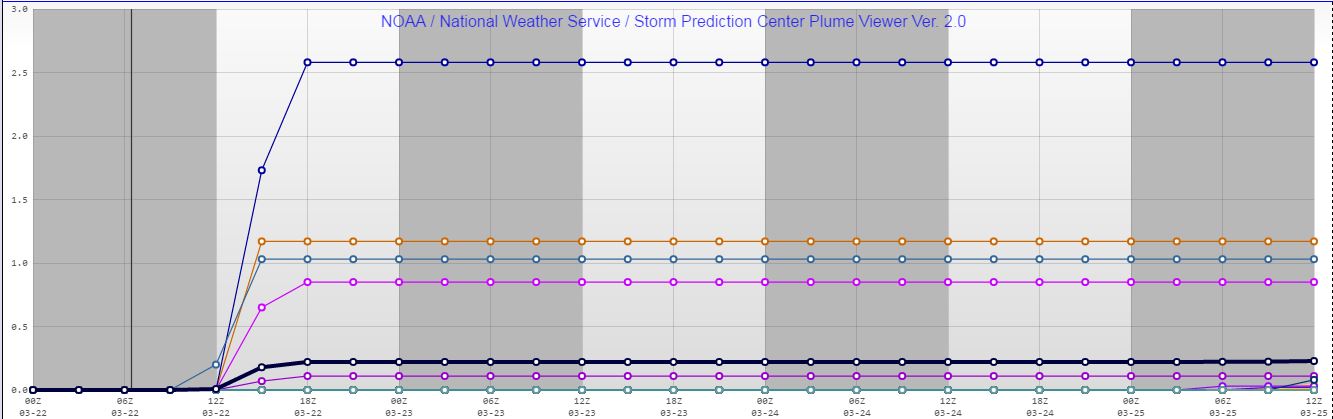
Now the largest problem remains is will the temperatures cool down enough to support snow. The models vary in this regard and there is a fine line as to whether or not snow can fall and then whether it will get heavy enough so it can accumulate on roads. The odds of rain changing to snow over the Inland Northwest look fairly good especially over Idaho and southern Spokane County and northern Whitman County. However a tougher question to answer is will the snow be able to accumulate on the area roads? If the snow gets heavy enough the answer is yes, however if not, most of the accumulations will occur on grassy surfaces. So once again lets look at the plume diagrams to see how much snow 27 different model runs produce over Spokane, Coeur d'Alene and Pullman.

Spokane plume diagram shows snow totals ranging from 0.0 - 2.5" with an average around 0.3" 


Coeur d'Alene plume diagram shows snow totals ranging from 0.0 - 5.3" with an average around 0.8" 

Pullman plume diagram shows snow totals ranging from 0.0 - 3.5" with an average around 0.5" 

Generally speaking, these values are on par with what the models were showing last night, however with the band moving further to the north, the snow totals in Pullman are trending lower. Motorists are still urged to check the latest forecast before venturing out in the morning and be prepared for a potentially snowy commute. Here is our latest snow forecast.

Snow forecast for Tuesday (issued 9 pm Monday )


1145pm Monday Update....the band of precipitation was beginning to take form. Our confidence is growing the moderate to locally heavy precipitation band will develop. Still not sure if heavy snow will accumulate.

1147pm radar imagery. Note heavier precipitation developing between  Davenport and Ritzville. 


Is a significant snow event possible for Spokane,Coeur d'Alene or the Palouse Tuesday morning?


Although the weather of late has been quite wet, the overwhelming majority of the precipitation has fallen as rain (or melting snow) in the valleys of eastern Washington and north Idaho including the Spokane/Coeur d'Alene area and the Palouse. That might change however as an unusual weather pattern materialises on Tuesday morning resulting in the possibility of significant snow. So what is the weather pattern which might lead to this unusual snow? To get significant snow in the valleys this time of year you need several things. First, you want to have a fairly strong upper-level trigger. In this case, we will be dealing with a slow moving upper-level disturbance or vorticity maximum.

500 mb pattern 2 am-2 pm Tuesday

The emphasis is on slow. The loop above shows the disturbance quite nicely between 2am-2pm Tuesday. The green area represents where the forecast model is placing the best moisture. Notice the feature also looks like a semi-circle indicating a tight circulation in the upper atmosphere which should lead to increased upward motion.

Another ingredient we like to see to enhance this upward motion is deep instability. This helps enhance the upward vertical motion between the ground and the upper atmosphere. So will the atmosphere be unstable? You bet. The orange and red shading indicates where we expect to see the most instability (however it's unstable everywhere across the region.
Lapse Rates through the mid-atmosphere 2am Tue
So couple the presence of the instability and the upper-level disturbance and here is where one model solution suggests we will see the greatest lift. Areas in purple and light purple are where the models expect to see the greatest ascent and thus the best potential for precipitation.
Upward motion through the mid-atmosphere 2am Tuesday

Finally, you need an atmosphere which is cold enough to support snow. This is the least confident part of the forecast. Model solutions are suggesting that the temperatures before the precipitation arrives early Tuesday will be above freezing, but then they slowly fall as the precipitation intensifies during the morning at least over a very small area (denoted in light or dark blue).

8am Tuesday Temperatures

So we have the ingredients in place for a heavy precipitation event (albeit fairly localized). Now the question is where will this band of precipitation set up and will it become heavy enough that it can produce accumulating snows in the valleys. That is a tough question to answer since there has been considerable model variability. What we can gather is more often than not the model solutions have depicted a northwest-southeast or west-east oriented band of precipitation similar to the two panes in top portion of the image below. Some of these amounts are quite impressive. The areas in purple show precipitation amounts above 0.75 inches and the red areas are showing more than an inch. So is it possible that most of not all this will fall as snow? It is certainly a possibility. 

12hr precipitation amounts forecast between 2am-2pm Tuesday
So just how much snow are we talking about?  Well here is a plume diagram showing 27 different model possibilities or solutions for the Pullman/Moscow area. While some of the models are hinting at a little more than a trace of snow, the most impressive solution is showing nearly 8 inches! The average snow amount from all the variations is just over 1" of snow.  For the Spokane area, the forecast is nowhere close to as snowy as for Pullman. The maximum snow forecast is around 2.25" but the average is around a quarter inch. That's a lot of variation, to say the least. 

Plume Diagram for snow for Pullman (Click image for larger view)


Plume diagram for snow for Spokane (Click image for larger view)

So what do we expect to happen? We are fairly confident we will see a band of moderate to locally heavy precipitation develop on Tuesday morning. Again the question is where will this occur and will the atmosphere be cold enough to support heavy snow? The other variable is will the ground be cold enough allow accumulations to occur on the roads? If the snow gets heavy enough (quite possible) we suspect the answer will be yes. Motorists are urged to prepare for the possibility of winter driving conditions for the Tuesday morning commute. Chances are the afternoon commute will be much easier as any threat of accumulating snow diminishes. Hopefully, as the event nears our confidence will grow as to where we expect to see the greatest risk of significant snows.