Showing posts with label cold. Show all posts

Thursday, January 9, 2025

La Nina is officially here, so what does that mean for the Inland Northwest?

La Nina is here!

 After months of a La Nina watch, it finally became official, and we have entered into the realm of La Nina (albeit it a weak one). Ocean temperatures in the key ENSO monitoring region of the tropical Pacific have finally dropped below normal for a period of three consecutive months which makes the declaration official. We've been getting a lot of questions about what this means plus what have we have experienced thus far. So, let's take a deep dive and see what this means for the Inland Northwest. 


In a typical La Nina weather scenario, we see cooler and wetter than normal conditions for eastern Washington and north Idaho as the polar jet is typically oriented from the Gulf of Alaska into the Pacific Northwest.


But the typical weather scenario is generally reflective of moderate to strong La Nina episode, and this has not been the case thus far as we've only now reached weak La Nina conditions. 


The model consensus moving forward suggests this La Nina will be quite weak and temporally brief.  Most of the models suggest we are at the coolest sea-surface temperatures now with subtle warming expected moving forward. 


The Winter so far

  For those keeping track at home, it's been a very wet winter thus far. So how wet has it been? For the water year (beginning in October) most areas in eastern Washington have seen precipitation amounts above 150% of normal with portions of the Columbia Basin seeing twice the normal amounts. Meanwhile over portions of the Idaho Panhandle conditions have been closer to normal. 


From a historical perspective that places much of the region in the top tenth percentile for wetness from Oct-Dec with pockets of record values over central Washington. 


From a La Nina perspective that was anticipated, but the temperature portion of the equation has not panned out accordingly. All of the Inland Northwest has experienced a very mild beginning to the winter. Take a look at these temperature departures (most locations are running about 3-5°F above normal)


From a percentile perspective, that places much of the region in the top tenth percentile for this time of year. 

Additionally, the coolest temperatures this winter have been anything but winter-like. In Spokane, the coolest temperature reported this winter was 24°F (reported on December 2nd). This is the mildest minimum temperature through January 8th in Spokane since records were kept in 1882. 


In Lewiston the coolest temperature thus far was 26° (reported on 12/10) which was only exceeded once in 1935. 

So, if you combine the very wet conditions with the mild temperatures, what do you get? A general dearth of snow in the valleys, with some significant snow amounts in the mountains (at least the higher ones). In Spokane, we've seen 12.4" of snow thus far which doesn't make the top 10 list for least snowy beginnings to winter (we'd have to have less than 6.2" to achieve that mark).  


Of course, not all valleys are seeing a lack of snow, compared to normal, but most are according to this map. Yellow and orange shading equates to below normal snow depth, while blues show above normal snow depth. 


  If you look closer, you will notice quite a bit of blue over the mountains. Currently all drainage basins over eastern Washington into north Idaho are showing near normal or higher than normal snow water equivalent values (the amount of water contained in the snowpack) for this time of year.


You might ask yourself what's the cause of the warmer and wetter than normal weather thus far. That answer isn't easy to tackle, but if simply examine the prevailing storm track by looking at 500 mb heights (around 18k feet) from November-December it reveals some hints. The longwave ridge axis has been positioned over western Montana this winter which places the Inland Northwest in a predominant west-southwest flow (left image) and favors mild conditions. If we compare this to the storm track in 2022 (right image) which was the last moderate La Nina, we can see significant differences in the storm track. The beginning of that winter showed a longwave ridge displaced over the eastern Pacific which places the Inland Northwest under a cooler west-northwest flow regime. The beginning of that winter was much cooler and snowier than normal.  


 If we add up the impacts of the temperatures thus far combined with the persistence of snow cover (or lack thereof) this has been an exceptionally mild winter. We can measure the severity of the winter using something called the Accumulated Winter Season Severity Index which takes a look at the intensity and persistence of cold as well as snowfall and the persistence and amount of snow on the ground. When looking at Spokane, here is how we have fared (if you go to the link above you can query other cities in the Inland Northwest) thus far. 


This is unquestionably the mildest winter we have seen in quite some time. So far, the AWSSI is tracking quite similarly to what occurred in 2004-05, but that was a weak El Nino season. Notice that year, the winter bolted up significantly in severity sometime in mid-January. That's not to state we will see the same occurrence this year. Every winter is different and the distinction between a La Nina or El Nino episode is just one of the factors that influences the long-range weather. 


The Winter yet to come

  The longer-range models continue to suggest we are in for a pattern change in the near future. The longwave ridge axis which persistently been over us or just to our east of us for most of the winter looks like its headed for a significant migration westward.  This is called a retrogression. It's just a matter of when it will occur. According to this run (01/09 00z) of the European Ensembles, significantly cooler weather could arrive just before next weekend. 


Granted this is just one model run from the EPS, but there has been some run-to-run consistency which gives us a little more confidence in this overall pattern transition. 


If we simply look at temperature anomalies associated with this pattern change, it suggests we should see widespread cooler than normal temperatures by next weekend. 


And this is expected to continue through at least the end of the month (we only show through the 23rd, but other model data we have access to shows this pattern holding firm). 


If you love cold, winter-like temperatures, this offers you some hope. On the other side of the coin, this pattern isn't one terribly conducive to snow, at least not yet. Here's a map of the precipitation departure from normal from 1/16 through 1/23 which shows much drier than normal conditions. 


Once we get into February, the Climate Prediction Center (CPC) is still forecasting a colder and wetter than normal period through April, although that forecast was last updated December 19th. 
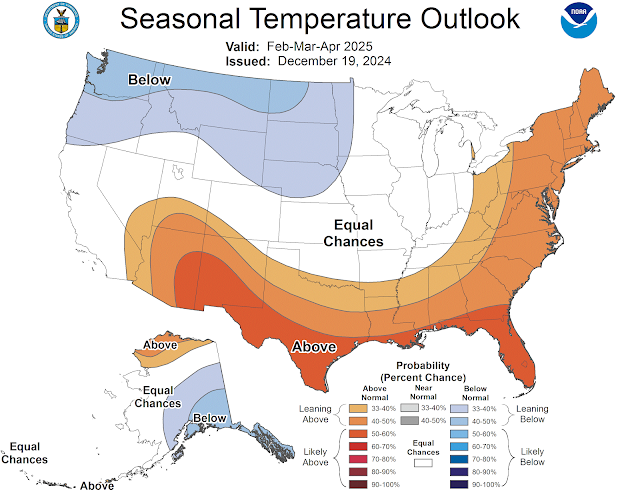


Although the official CPC forecast hasn't been updated since December, it is backed to a certain extent another long-range model, the North American Multi-Model Ensemble (NMME). The latest NMME forecast (issued January 7th) is forecasting near normal temperatures and wetter than normal conditions (at least through March). 


All this being said, it doesn't guarantee that winter is going to get into full gear in the near future. The long-range models are not infallible, nor are monthly outlooks. However, it looks like things are at least trending away from the very mild conditions we've seen thus far for the winter of 2024-25. 

Friday, November 4, 2022

Storm Part 2...Will your house have electricity in the morning plus a look beyond?

There's a good chance of seeing multiple power outages tonight with our upcoming wind storm.  And depending on how many outages there are, our much-appreciated hard working utility folks may not have all the power back on before you get up Saturday morning.  As such, you may want to make some contingency plans.  It would be a good idea to charge your battery powered devices this evening just to be safe. 

Round 1 of our storm series is over. The main result of it was heavy snow which fell over many parts of the Inland Northwest overnight and into this morning.  It is very unusual to have this much snow this early in the season, let alone for the first snow of the season. Here are the morning snow totals.  Since it snowed much of the morning, these totals will likely increase from what's posted here.


Now it's time to get ready for Round 2 and it could be a doozie: the wind storm.  The various computer models have their usual disagreements, but they're all saying it's going to be windy tonight.  One chart we often look at for wind events is the 850 mb wind forecast.  Think of this as the winds about 3000-5000 feet elevation.  Usually a wind of about 50 knots (58 mph) will get our attention.  In this instance, the GFS is forecasting 65 to 78 knots of wind tonight!  Other models so something of a similar magnitude.

850 mb winds for 11PM Friday

So the question is: can that wind that is 3000-5000 feet overhead mix down to the ground?  The answer is quite complicated and difficult to answer.  Meteorologists often struggle with this a lot.  In some instances, those strong winds above us stay above the ground and we never feel them.  But there are situations where those strong winds do make it to the surface.

One of those mechanisms is cold fronts.  And that's exactly what we'll have moving through our area tonight.  The front is moving west to east, and will go through Spokane around 1am tonight.  Before that, the rain in the Spokane area will taper off around 6pm, and then the winds will begin to crank up.  It will be windy with gusts up to 50 mph late this evening and then the front plows through. We still think there is a good chance that when the front goes through, we will see wind gusts in the 60-70 mph range for some locations.  The damaging winds should begin to taper off  before sunrise Saturday.

Here's the peak wind forecast.  Keep in mind that the valley locations like Colville and Republic may not see the highest wind speeds, but they have more trees to potentially knock down and thus produce more power outages. 


So what can we expect from an event like this?  At this point, there are some similarities between this event and the 13 Jan 2021 event.  That event had 850mb winds of 57 knots just before the cold front came through, which resulted in a gust to 71 mph at Spokane Airport.  But similar to tonight's event, the strong winds only lasted about 3 hours.  Still, the tree damage was significant, and power outages lasted for several days in some locations.


After the wind storm, we aren't done with the active weather, we still have Rounds 3 and 4 to contend with. 

Round 3 promises to deliver more snow, and in some cases it could be significantly more than what we just saw. The heaviest snow possibilities are honing in on north-central Washington.  The surface low will track south of us, which favors that part of the Inland NW due to easterly low-level winds pushing into the Cascades. This will cause rising air over much of that area, rather than the more typical downslope/rain shadow effect.  Snow should start there on Sunday morning.

Surface low position (off Vancouver Island at 11 am Sun) and precipitation

But since this low is tracking south of us, the front will move very slowly across the region.  It won't reach extreme eastern WA and the Panhandle until 24 hours later, Monday morning.

Surface low position and precipitation as of 11 am Monday

Here's the current forecast storm total snow for this event.  


And lastly, Round 4 will be the unusually cold temperatures that move into the region behind this storm.  There's a good chance that some locations will break daily records.  Here is a list of the record highs which could be broken (denoted in yellow):


As well as the record lows (denoted in yellow):


If there are widespread power outages from the wind or upcoming snow event, the cold temperatures next week could have a much bigger impact than they usually would. 


Saturday, January 14, 2017

A wintry mess before the very wet and milder arrives next week?

So as we mentioned in our previous blog post, we are expecting to finally break out of this latest cold and dry weather pattern by early next week. So what is going to be responsible for this change? Here is a look at the current weather maps which are supported by what we see on satellite (a good sign if we want to follow a particular weather model):

500 mb map (left) with Integrated Vapor Transport (shows atmospheric rivers denoted by bright colors). Water vapor satellite imagery  on right. 
The most noticeable things on the left chart are the large high pressure ridge centered over the Inland Northwest (Large H) as well as the atmospheric river developing north and west of Hawaii. Over the next several days we expect the presence of the high to persist over our area. This means more fog, low clouds, and very cold temperatures in the valleys with light winds. This is because high pressure systems in the winter typically lead to strong inversions (temperature increasing with height). This is especially true when there is widespread snow cover over an area and clearing skies. This is certainly the case right now as we have seen many mornings recently with sub-zero temperatures and mainly clear skies. Here is a look at just how strong the inversion was this morning at our office.

1/14/17 4am weather sounding at NWS Spokane. The red line shows how the temperature varied with elevation. The farther to the right the red line is the warmer the atmosphere is. Notice how the temperature increases all the way from the ground up to 4700'. That is what we would call a strong inversion. 
So why are we telling you about this inversion? Because what happens between now and Monday night will be critical into producing an accurate weather forecast. But more on that later. So first, what do we expect to happen to that atmospheric river forming north of Hawaii? By Monday night here is what most of the weather models are showing.
Atmospheric river position 10 pm Monday 1/16/17
According to this we should see the ridge being rapidly replaced by the atmospheric river moving in from the Pacific. Not only is this air stream moist, but it will be warm as well. So that should mean we would see a rapid transition from the current chilly air mass to a much milder one, right?. In other words we should see any threat of snow changing to rain and probably in a short amount of time. But if only it were that easy! This upcoming system will likely provide us with all sorts of weather conundrums simply based on the inversions we showed you earlier.   Here is an example from Moses Lake.

Weather Sounding from Moses Lake 4am Tuesday with the freezing line denoted in pink.
So as the precipitation arrives it could begin as all snow as the entire atmosphere will have temperatures below freezing. But as the atmospheric river comes into the area (being ushered in by southwest winds of 30-40 mph 3000-10,000 ft above the ground) the temperatures above the ground will warm faster than those near the ground and this will create what we call a melting layer or warm nose of air aloft. What this means is any snow which forms in upper portions of the atmosphere will melt as it traverses the melting layer. If the melting layer is deep enough it will melt anything which falls into it. If it's not deep enough it will only partially melt the snow falling into it. In this case we are looking at a melting layer around 4000-5000' thick which should be plenty deep to melt most of the snow falling through it. That's not the whole equation though. What happens after that depends on how deep the freezing layer near the ground is. For the sounding above the freezing air near the ground is around 1500' thick so the question is "is this deep enough to completely freeze what melted before hitting the ground"? If the answer is yes the melted snow would completely refreeze producing sleet or ice pellets. If its not deep enough the melted snow will not refreeze and instead fall as a very cold rain which can easily refreeze once it contact a sub-freezing object on the ground. Here is a nice weather schematic the NWS office in Omaha created that shows the complexity of forecasting winter weather precipitation types.


So what does the profile in the Moses Lake sounding favor? That is always a tough question to answer as any perturbation in the strength/depth of the above ground melting layer and near ground freezing layer has a direct impact on the precipitation type.  If nothing were to change in the models we think this would lead to freezing rain. However the no change argument isn't one that often appears as much as we would desire. Since this event is still a few days away there are numerous answers as to what might occur. While we are confident we will see precipitation, we are far less confident in what the prevailing type of precipitation will consist of. Each model is advertising a different scenario. When we see such great differences we sometimes like to defer to what we call an ensemble model solution. This is were we take the same initial model and introduce very small changes at the very beginning of the run. These small initial changes can lead to vastly different solutions as you get farther into the forecast. So here is a snapshot of the various precipitation chances associated with the incoming weather make during the Tuesday morning commute.
4-panel ensemble solution for the precipitation type on Tuesday morning. Upper left corner=Sleet chance, upper right=Snow chance, lower left=freezing rain chances, lower right=measurable precipitation chances

The image above is about as messy as a weather forecast can get around here. As for sleet or ice pellets (upper left), we'd expect to see the best chances to occur over the western Columbia Basin and into the northern valleys east of Omak. The snow chances (upper right panel) would be highest near the north Cascades, northeast Washington, and over the northern Panhandle. Meanwhile the threat of freezing rain looks most prevalent over the remainder of the the Inland Northwest. But that is what the latest ensemble model runs suggest and this could change significantly as the event nears. Previously we were expecting to see a lot more snow with a brief changeover to freezing rain and then all rain. If we see snow first the freezing rain impacts could be somewhat mitigated as freezing rain falling onto fresh snow has much less impact on driving conditions then freezing rain falling onto bare pavement. Stay tuned to the latest changes in this evolving portion of the forecast.

Eventually (how long is uncertain) the atmospheric river will bring the warm moist over the entire region and mix it down to the ground with the most of the snow or freezing rain chances remaining near the north Cascades or over the far northern valleys. Here is what the temperature profile looks like for Moses Lake at 10 am Tuesday. Notice it's entirely above freezing which means we would see all rain.

10am Tuesday temperature profile for Moses Lake
Once the lower atmosphere warms above freezing we expect it to remain above freezing through the end of the event.The end of the event will likely consist of a good amount of time as the atmospheric river remains fixed over the area. Here is the expected position on Wednesday afternoon and then on Thursday.
Atmospheric River position on Wednesday 1/18/19 4pm.
Atmospheric river position by Thursday morning 1/19/17

That means the atmospheric river will be over the region beginning Monday night and persisting into early Thursday. Needless to say that can result in a lot of precipitation. Just how much are we expecting? Here are four distinct model runs.

72 hour precipitation ending 4 pm Thursday
Surprisingly there is very good agreement for a forecast this far out. We are quite confident that the precipitation over the western Columbia Basin and in the lee of the Cascades is a little bit overdone, and near the Cascade Crest and over north Idaho it might be underdone. Nonetheless these are some very impressive precipitation amounts. Looks like the eastern third of Washington and the Idaho Panhandle should generally see anywhere from 1.50"-3.00 inches. If there were no snow on the ground this alone could produce some issues with low-land flooding and perhaps some ice jam flooding as the ice breaks up on area rivers. However that is not the case as we have an appreciable amount of snow on the ground. Here is a look at the approximate amount of water tied up in the snow pack.


That is quite a bit of water or potential runoff sitting on the ground and will only add to the runoff totals. Based on the forecast temperatures, we expect to see temperatures remaining above freezing from Tuesday through much of Thursday (including nighttime low temperatures). The above freezing temperatures will combine with breezy winds resulting in a great setup for appreciable melting. The best melting potential will occur the SE third of our forecast area with the least amount near the Cascades and far northern valleys. We still expect to see most if not all the snow to melt over the Palouse, LC Valley, and eastern Columbia Basin. So combining the expected rainfall with the water from the snow melt could equate to up to 2.50 to nearly 5.00 inches of water which could potentially runoff. This increases the odds for flooding appreciably. Here is a map of where we anticipate the greatest flooding problems to occur.


We expect most of the flooding issues will involve low-land flooding, ice jam flooding, and urban flooding (think snow clogged storm drains...clear them now if you can!). Small rivers and streams could also flood, especially over the Palouse and nearby areas. As of now we are not expecting any mainstem flooding, however that could change especially if we melt more snow than expected.

If we look into the longer range weather forecasts, we don't expect to totally dry out, but we will cool considerably. Not down to current levels, but certainly enough to refreeze what doesn't melt. The pristine snow cover we have over us will look completely different by next Friday and could feature hard snowpack and frozen slush.

Please stay tuned to the latest forecasts for this upcoming situation...it will likely be a messy situation and is certainly subject to change. Oh yes...the countdown to spring is now 64 days and counting.

Tuesday, January 10, 2017

Much warmer weather is expected next week after prolonged cold!

If you think this winter has a rather drastic change from the past several winters your senses are not deceiving you. When we began the month of November is seemed we would see yet another mild November, however as the calendars changed to December that notion came to an abrupt halt. The start of 2017 has continued that trend. Look at these statistics for Spokane and this will put things into perspective.


It certainly seems the mild winters of the past several years are a distant memory. This has been the snowiest winter since 2008-09 and the coldest since the early 90s. But the cold wasn't just in Spokane. Check out this list of sites that have seen their record coldest December-early January period on record (keep in mind some of these station records don't go back too far, see last column for details).


So we can see it's been cold and somewhat snowy. To see how snowy its been look at this comparison graphic of satellite pictures from early December vs. early January. 

Satellite comparison of snow cover via visible satellite. The January image suggests just about all of the Inland NW is covered with snow. 
This is quite a change. But its winter and it's not unusual to see widespread snow cover at the beginning of January across the entire Inland Northwest is it? Here is a look at the amount of water in the snow (Snow Water Equivalent- SWE) on each January 10th since 2008. 


Based on this, we actually saw the entire region covered by snow in 2016 as well. But this year and that were the only ones since 2008.  So if there is snow covering the entire region should this lead to concern? Well it depends. If we could melt all the snow at once it could cause a great concern due to runoff and potential flooding. This time of year it is improbable that we can melt all the snow over the mountains (where you can see the dark blue, purple, and red shading) as it doesn't get warm enough but we can melt some. But it is quite a bit easier to melt a significant (if not all the snow) in the valleys where we see the abundance of white and pale blue shading. Any area shaded in white has at least an inch of water tied up in the snow pack while the light blue shading represents values ranging from 2-4" of water. So what does it take to melt this? Obviously we need to see temperatures above freezing for a prolonged period. But that's not all. It also helps immensely to add wind into the equation. Warm winds and prolonged temperatures above freezing are an enemy of the snow and can cause it to quickly disappear. Imagine taking that 1 to 4" of water trapped in the snow and sending it into the rivers and streams. How about taking that same 1 to 4" of water over urban areas and sending it toward snow-clogged storm drains? That can cause quite a mess and obviously would lead to flooding issues. This scenario can be further complicated by rivers and streams choked with thick ice. 

So why are we telling you this? Well it just so happens we are looking at a dramatic change in the weather pattern early next week. Since December, we have been stuck in a persistent weather pattern featuring cold weather systems coming from our northwest. These are notoriously cold systems, and generally pose little threat from a hydrology standpoint. 
Mean 500 mb (18,000' above ground) since December. Note how the colors (or heights) buckle north into Alaska and then drop SE into the remainder of the county. This is indicative of cold NW flow. 

When we compare this weather pattern to what's normal for this time of year we see a clear signal. The blue shaded areas represent below normal heights which generally result in cold weather whereas the orange, yellow, and green shading represent warm conditions. 
500 mb height anomaly values. 
This is quite unusual. Typically we see some warmer systems invading from the southwest tied to a nice tap of relatively warm sub-tropical moisture. When these systems arrive they can bring a rapid warming in temperatures as well as significant precipitation and snow melt. Well after a long respite from such systems, we see hints of one on the horizon. Here is what many of the forecast models are hinting at for next week. 

Weather pattern for next Monday evening (500 mb heights in white, precipitable water is shaded)
What this reveals is our northwest flow of late will be replaced by southwest flow early next week. Of even more concern is the swath of green and blue shading headed into the Pacific Northwest. This indicates we will be subject to a very moist and warm air mass, which could do a very effective job of melting the low-level snow pack. Now if this feature were only going to be over us for a day it may not do much to the snow pack. However look at this map below for Wednesday. Not much difference is there?

Weather pattern for next Wednesday (500 mb heights in white, precipitable water is shaded)
So this at least indicates the potential for warm weather. Here are our forecast highs for next Wednesday. 
Forecast temperatures for next Wednesday
Notice most of the valley temperatures are above freezing. This will be good for potentially melting the snow, especially over the SE portions of Washington and NC Idaho where you see the greens (temperatures above 45°F) during the day. But what we aren't showing here is many locations across the same area will also see nighttime temperatures remaining above freezing. So its conceivable that some locations across SE Washington and NC Idaho could see temperatures above freezing anywhere from 48-72 hours. We will also see robust south to southwest winds during portions of this period. Below is the wind forecast for Tuesday. These are sustained winds. The gusts will likely range from 20-35 mph. 

Tuesday wind forecast
So remember earlier when we said about above freezing temperatures and good winds can result in some rapidly melting snow. It's conceivable that a good portion (if not most) of the snow over the Palouse, southern Columbia Basin, LC Valley, and even parts of the the Spokane/CdA could melt during this episode. So that's a significant chunk of the 1 to 4 inches of water tied up in the snow pack which could runoff into the area rivers. What we haven't talked about yet is how much precipitation can we expect in this upcoming weather pattern. The map below shows the GFS model forecast for precipitation amounts possible in a 48-hr period ending Wednesday afternoon. 

Tuesday-Wednesday precipitation forecast
This is a very impressive amount and is one of the wetter model runs. Locations shaded in yellow are amounts ranging from 1.50" (around Spokane) to nearly 3.00" over parts of the Idaho Panhandle. We suspect the valley precipitation will likely be overdone, but perhaps the mountains aren't showing enough precipitation. The combination of snow melt combined with ample precipitation could lead to some bad things across the region including:
  • Flooding of small rivers and streams (especially over SE Washington and the southern ID Panhandle).
  • Lowland flooding where the ground is frozen prohibiting infiltration into the soil. 
  • Ice jams could give way and enhance the flooding potential.
  • Urban flooding is a distinct possibility given snow-clogged storm drains.

But since we like to be purveyors of positivity let's not dwell on the negative and instead focus on some of the potential good:
  • We will finally be able to walk on snow-free sidewalks, 
  • We can drive on snow-free roads, 
  • Just imagine how warm and refreshing 40s will feel compared to more single digit and teens. 
  • The ice dams on snow-covered roofs may finally melt thus alleviating our worries of potential roof damage.
  • Much smaller worry of frozen pipes.  
  • We won't have to bundle up in countless layer of clothes just to shovel the latest dump of snow. 
  • Spring is only 68 days away!!