
Now often during El Nino years the Pacific Jet Stream sends storm south of our region bringing wet weather to California. Now the exact placement of this can be different from year to year with some years bringing wet weather up into the Pacific Northwest. We will come back to this later.
So how strong will this El Nino be? Well the Climate Prediction Center is favoring a weak event. Here is the latest forecast from various models.

Nearly all model solutions are showing El Nino conditions this winter.
So with a weak El Nino event, you may be asking what happened in prior weak El Nino years. That is a great question! Let's look at six cases since 1950 including 1958-59, 1976-77, 1977-78, 2004-05, 2006-07, 2014-15. If we average the temperature and precipitation anomalies from these six cases, here is what we get:

Milder than normal in the west, and drier than normal in the northwest. However looking at these maps doesn't give any insight to the variability that can occur. So let's begin with temperature anomalies for each weak El Nino event.

As you can see, all six cases brought near to above normal temperatures, so no surprises there. What about precipitation?
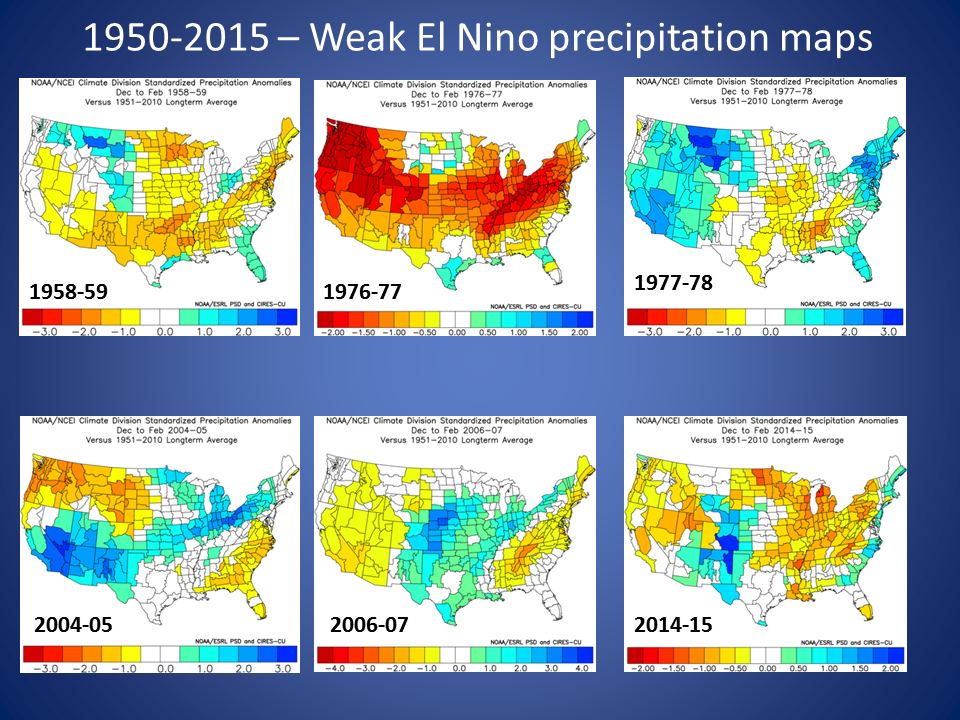
Quite a bit more variability. The past three cases near or below normal while the 1976-77 winter was our "drought winter". However 1958-59 and 1977-78 actually brought above normal precipitation. The latest outlooks from the Climate Prediction fit well with history. Higher confidence for near to above normal temperatures. Lower confidence of drier than normal which is only slightly favored over parts of the region.
 |
| CPC Temperature Outlook for Dec 2018-Feb 2019 issued Oct 18 2018. |
 |
| CPC Precipitation Outlook for Dec 2018-Feb 2019 issued Oct 18 2018. |
So what about snow? The milder temperatures typically brings below normal values to the lower elevations. Here is the percent of normal map.

As you can see most towns receive between 65-80 percent of normal snowfall. Now for cities not as sensitive to temperature who are often well cold enough for snow, higher values show up such as Republic (91%), Winthrop (96%), and Leavenworth (103%). For an interactive version of this map, click here.
So does this mean most of the Inland NW will see below normal snowfall this winter? Well the odds lean this way, but it is worth noting that some El Nino events prior to the 80s were snowy for some towns as the graphs for Spokane and Sandpoint show.
 |
| Spokane observed snowfall for weak El Nino events |
 |
| Sandpoint observed snowfall for weak El Nino events |
Now while milder temperatures are favored, this does NOT mean we won't see any big cold snaps. For example, the 2006-07 event brought a temperature down to -10F in Spokane.
 |
| Spokane Temperature data Fall/Winter of 2006-07. Solid red line is record highs. Solid light blue line is record lows. The dark blue lines represent observed temperatures. The top brown line is normal high while bottom brown is normal low. |
Another important factor is that even in El Nino years, significant weather events can and often due occur! The 2006-07 weak El Nino brought two wind storms. The December event brought damaging winds to many areas of the Inland NW. The January event brought a mountain wave wind storm to Wenatchee.


Even ice storms can occur, like the weak El Nino of 2014-15 in Leavenworth.

So in summary, a mild winter is likely with below normal snowfall in the valleys. Precipitation is less certain. And even if the winter as a whole finishes on the mild side, your town could be impacted by a short term significant weather event such as a wind storm, snow storm, ice storm, or even flooding. Be prepared and keep informed of latest weather forecasts!