As we talked about yesterday, we’re looking ahead to our late weekend strong wind event. Let’s dive right in with some model talk! Then stick around for what this will mean for impacts to those of us that live here. Our confidence is growing with how this event will unfold and the impacts we’re expecting.

First, model talk
In recent memory our big wind storm of Jan 13 is most notable as far as wind speeds and damage. Then there was the Nov 2015 storm that caused a lot of widespread damage as well. Many people have asked “How will this storm compare to those two?” and we’re ready to dive into talking about that.
Looking at the surface analysis for the Jan 13, 2021 event we can see the surface Low pressure up in southwest Alberta, Canada and a surface High pressure just near Portland, Oregon. The image below has been annotated to highlight the surface low pressure, 984 mb, and the high pressure, 1029 mb. The gradient of 45 mb is quite strong over this distance and gives an estimate of the wind speed blowing from High to Low pressure.

One of the strongest wind gusts for Jan 13 was the 71 mph at Spokane International Airport.
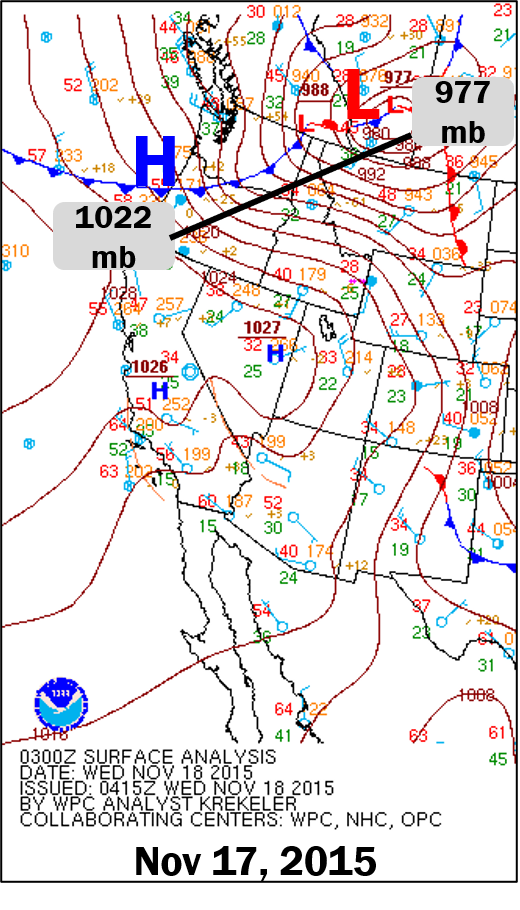
The next most recent high wind event that left quite a bit of damage across our region was Nov 17, 2015. Similarly enough, the max wind gust at Spokane Airport for this event was also 71 mph. Slightly different events that unfolded, but that was the max wind gust. Below is the surface analysis image annotated with the low and high pressures as well. The surface low in southwest Alberta had a low pressure of 977 mb and the surface high in western Oregon had 1022 mb for a surface pressure. This was a difference of 45 mb once again.
So now that we are nearing our Sunday night/early Monday wind event, what do the models look like? We’ll look at three different models: European ensemble (EPS), GFS ensemble (GEFS) and Canadian ensemble (GEPS) for comparison sake. First, here’s the European ensemble:
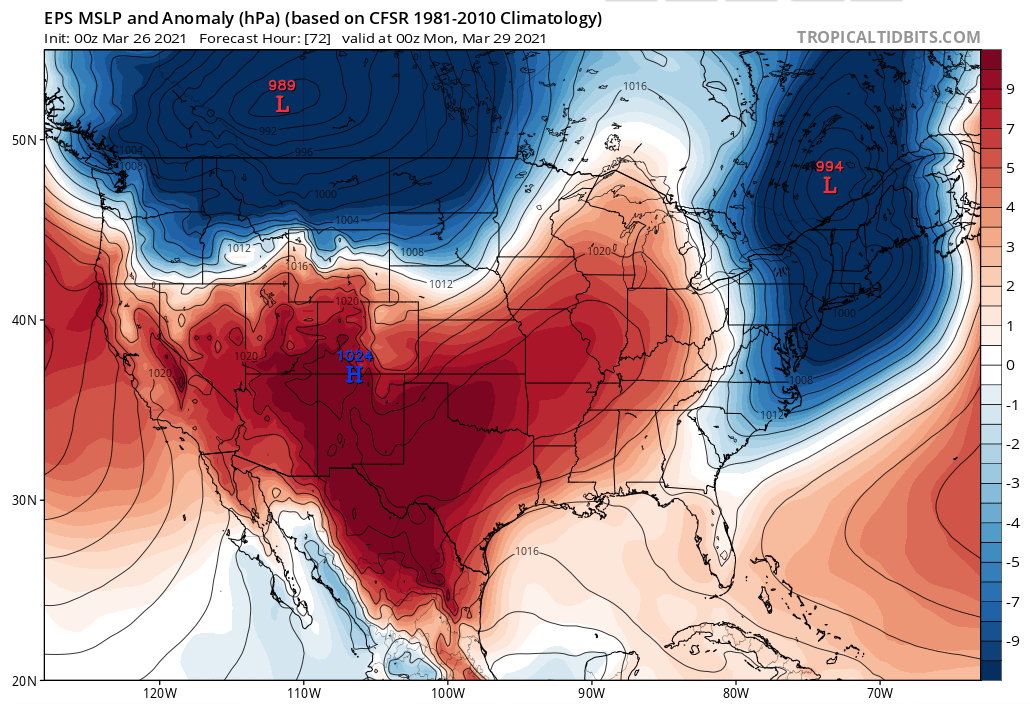
The mean MSLP low is around 989 mb over southwest Alberta and the high is 1024 mb over southwest Oregon, which would give a gradient of 35 mb. Among the various ensemble member forecasts, the surface low has been showing up in relatively the same place, clustering in a way. The clustering shows good agreement among all the different models. This is good! This helps build confidence in the forecast.
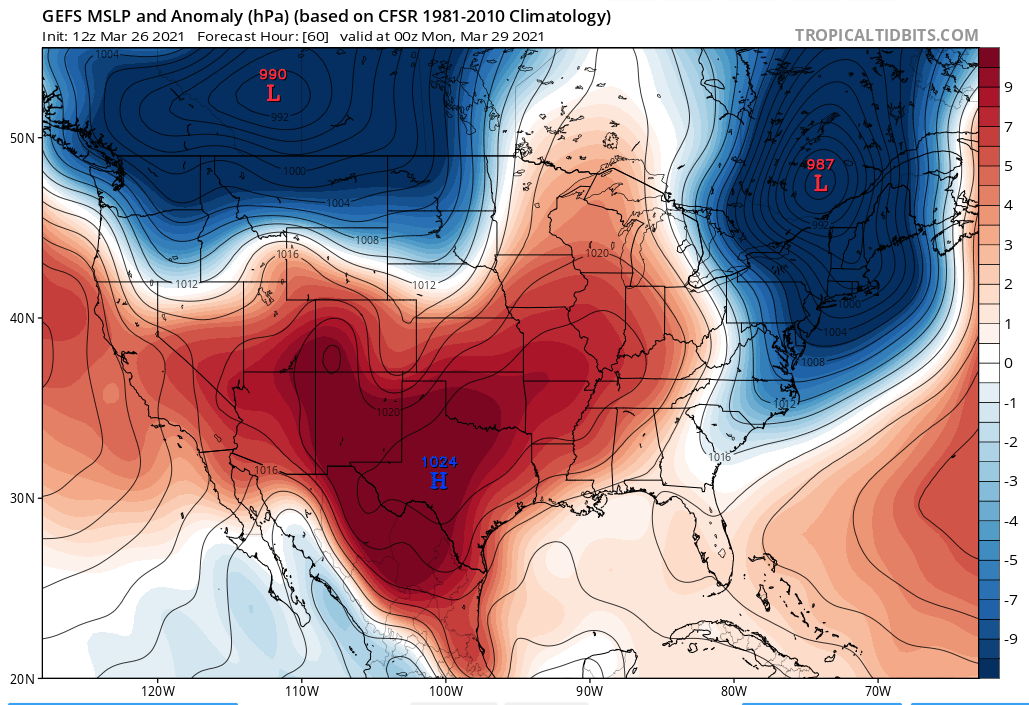
The image below shows the GEFS version of the mean MSLP. The surface low is being positioned in southwest Alberta again. The low is around 990 mb and the high is 1020 mb over southwest Oregon. So our gradient would be 30 mb.
The GEPS version is quite similar to the previous two models. Southwest Alberta low of 992 mb and southwest Oregon high of 1024 mb, which would give a surface gradient of 32 mb.
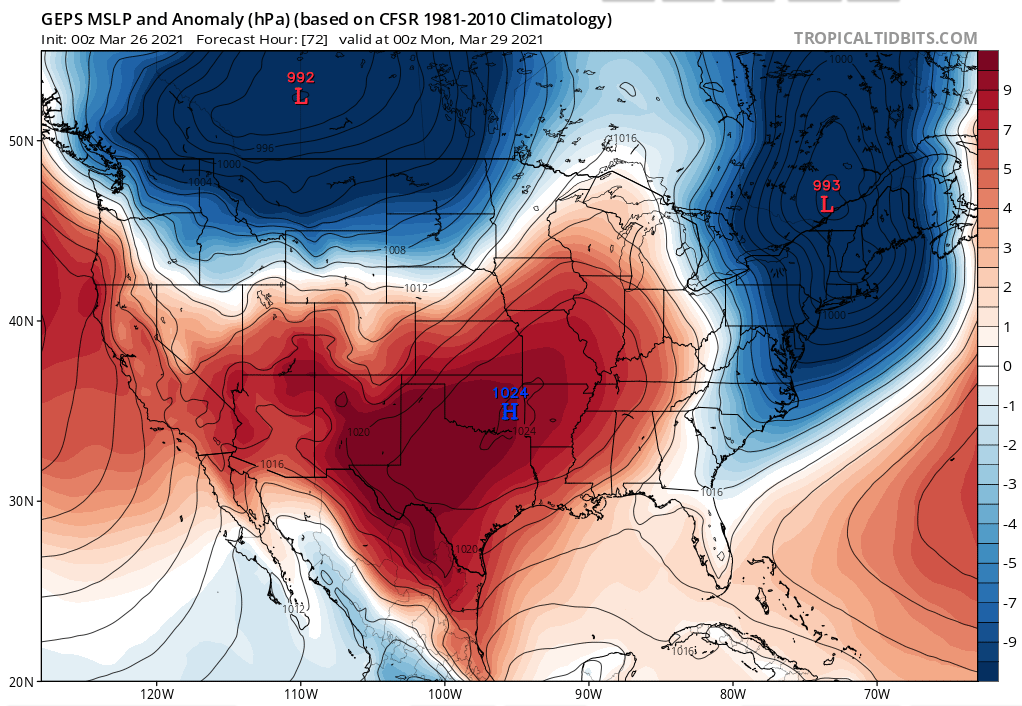
Given all of this, what can we say about the upcoming wind event? This wind event does NOT look to be as strong as those from earlier this year and in 2015, at least as of now.
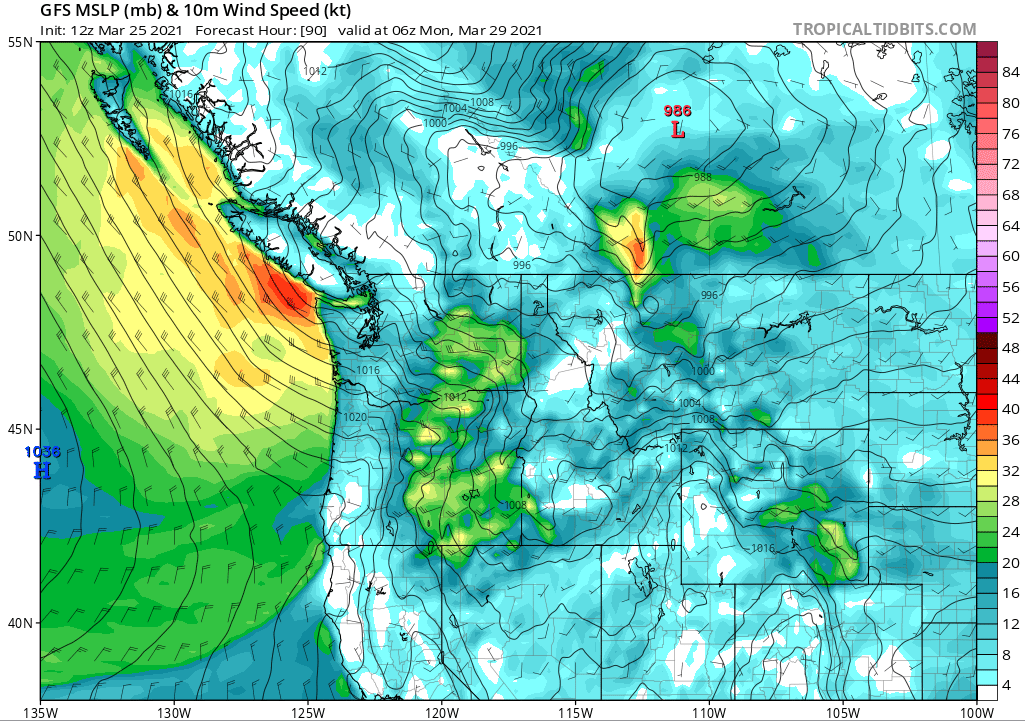
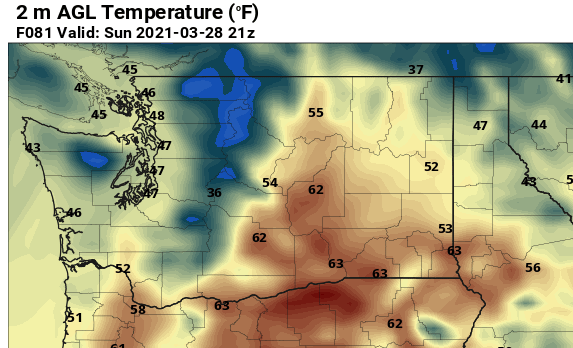
So, we mentioned that we like to look at how the models trend and perform. These are just a select few snapshots of model comparisons. Let’s look at the GFS first. The time stamp we are focusing on is 06z Monday which translates to about 11 pm Sunday night when we will be seeing the peak wind gusts. So as the model has been trending, the winds at 850 mb (which is about 2000-3000 feet above the ground) are showing 45-55 mph across the Columbia Basin and eastern Washington.
While a snapshot of a model is helpful, the ensemble version gives us a better idea of more members of said model and how it is all trending. More of a consensus, if you will. Below is a loop of how the GFS ensemble. Showing much of the same as the GFS loop, this is highlighting increasing potential for stronger winds at 850 mb, 45-55 mph and maybe even closer to 60 mph.
That’s a lot of science, so what do I do with that?
You may have asked yourself that, and that is a valid question. As we look at all the model output and try to put together a forecast, we take into consideration what this will mean for folks who live here. What kind of impacts this will create, hazardous weather, and trying to pin down a time is just as important as it is difficult to predict.
Strong winds
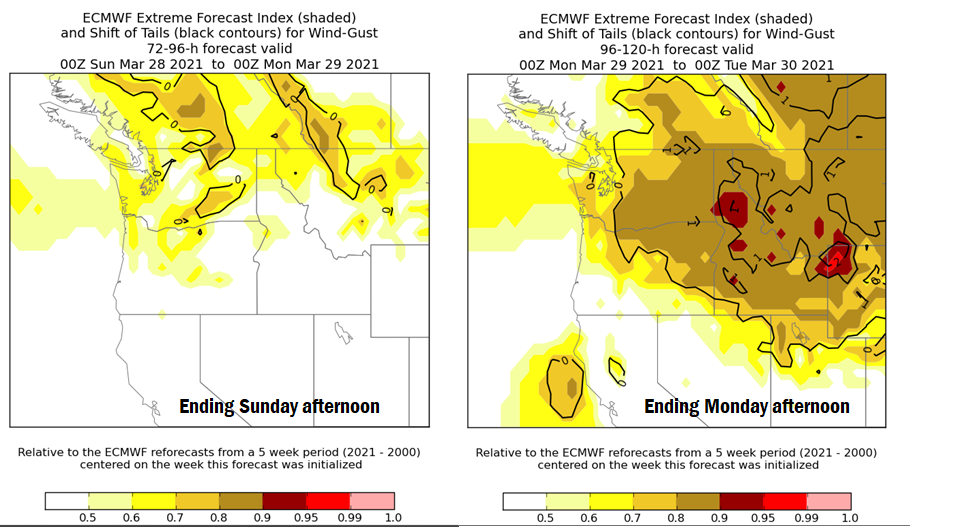
Our confidence is growing with each model run that we are analyzing and it looks promising the Columbia Basin and Palouse into the Idaho Panhandle will be the areas that see the strongest wind gusts. Winds will begin increasing through the day Sunday with our cold frontal passage expected during the evening and late night Sunday, giving us the time period of 6 pm - midnight for our strongest winds.
Wind gusts of 45-55 mph looks reasonable with growing potential to see locally higher values in select locations.
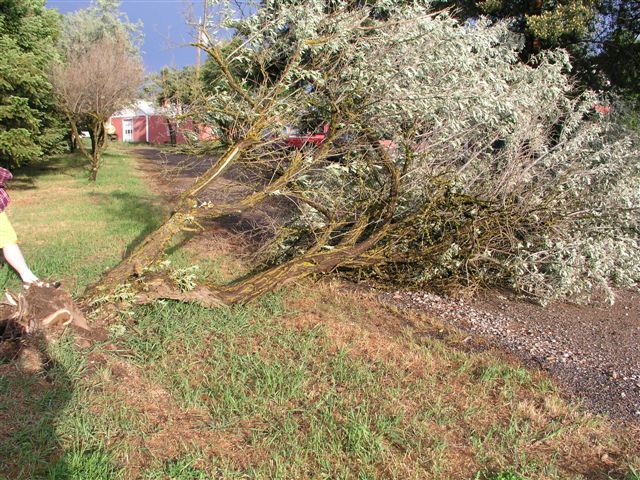
Image showing tree damage from strong winds (not from this event).
Blowing dust

The image above is not a current image but one from a previous event. This is to illustrate the potential for blowing dust Sunday.
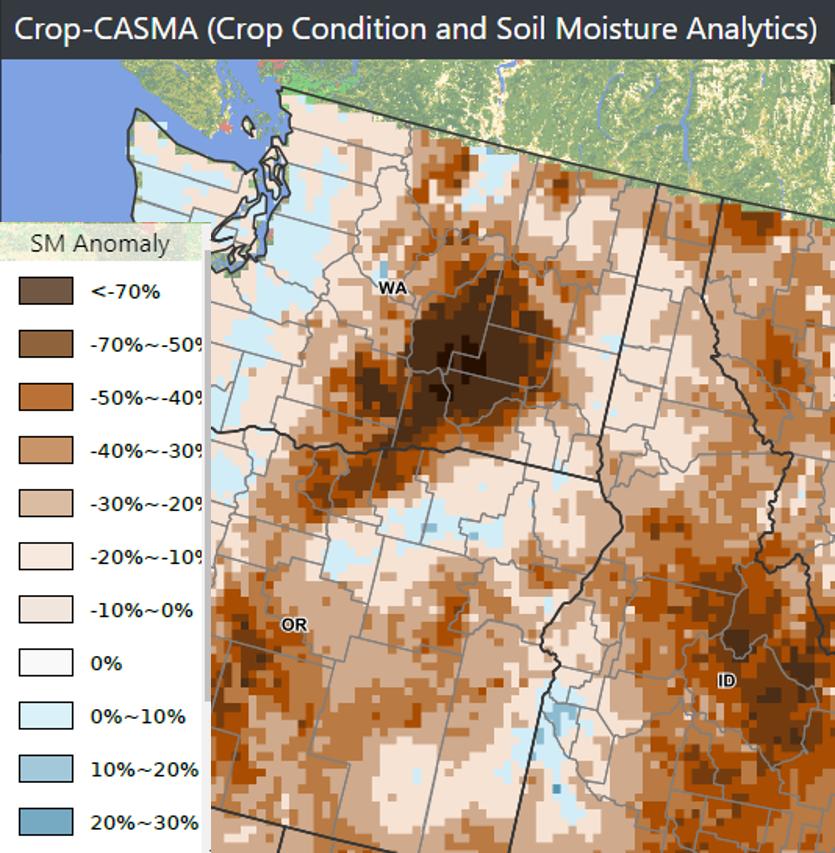
It’s getting to be that time of year when agriculture activity is increasing and fields are being prepped for planting. So much of the central and south-central part of Washington has seen a lack of appreciable precipitation in the last few months, so it is no surprise that this area will be dry and could see blowing dust with these strong winds. The below image shows crop conditions and soil moisture analysis. It shows just how dry the soils are across south-central Washington.
Stay connected for any forecast updates going through the weekend!