Wednesday, June 23, 2021

We are forecasting the hottest day ever in Spokane history

 A heat wave like no other is becoming increasingly likely.  Prepare NOW!


The biggest heat wave to ever strike the Inland NW on record is becoming increasingly likely.  What makes this event unique?

  • All time record high temperatures are in jeopardy for several locations
    • And this is during June (our peak heat season is late July through early August)
  • 100+ degree temps will last for several days
  • Mild overnight lows in the mid 60s to upper 70s will provide little to no relief at night
  • Occurring during a period of severe to extreme drought
  • Fire danger increasing to record levels next week and as we near the 4th of July (for this early in the season)
The Climate Prediction Center's latest Risk of Hazardous Temperatures product shows our region in a high risk of Excessive Heat through next Friday, July 2nd.  Don't be surprised by future outlooks extending this out further.


What is going to cause the excessive heat?  A very strong ridge of high pressure (record setting for late June by some model solutions).  Here is one ensemble solution showing the strong ridge centered right on top of us on Sunday.
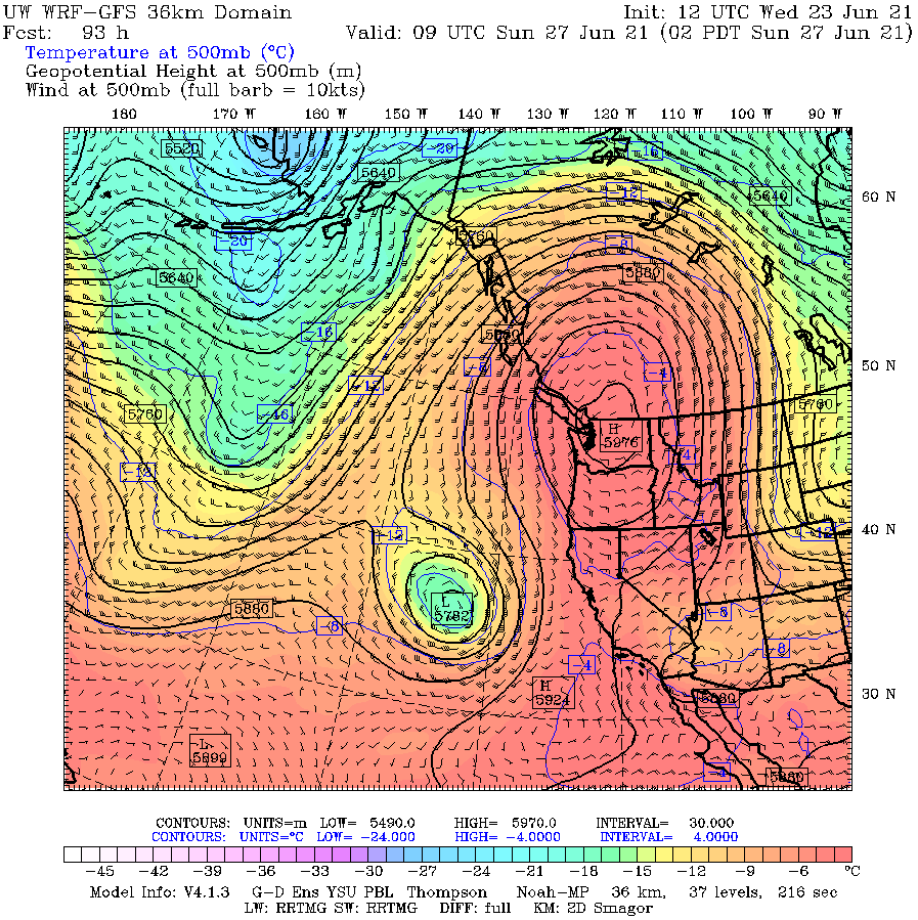
12z GFS model of 500mb heights, winds, and temperatures valid 2 AM PDT Sunday, June 27th 2021


Strong high pressure in late June spells trouble!  Why?  The lower atmosphere continues to warm as the ridge persists over the region as the late June sun angle brings an abundance of solar radiation towards the Earth's surface which continues to warm things up each day.  Here is one model prediction of near surface temperature anomalies from this Thursday through the following week (June 24-July 3rd).  


Note the large area of warmth that persists into early July over the northwest US and southwest Canada.

So it looks like this heat wave will be around for awhile, but how hot will it get?  Our current forecast is calling for all time records to be threatened beginning Monday.

NWS Forecast High Temperature for Monday, June 28th (issued June 23rd) as compared to current all time records.

And if we don't break the all time records on Monday, we will probably have another shot on Tuesday and Wednesday!  Here is our current forecast as of June 23rd for Tuesday.

NWS Forecast High Temperature for Tuesday, June 29th (issued June 23rd) 

It is worth noting that a few models (especially the GFS) want to take the heat up another notch, suggesting temps near or above 110F for Spokane and near 120F for Moses Lake.

Spokane

Meteogram of forecast raw model temperatures for GEG (Spokane International Airport) through Wednesday, June 30th, 2021


Moses Lake
Meteogram of forecast raw model temperatures for Moses Lake through Wednesday, June 30th, 2021

While these values are not currently forecast, it does have our attention.  The record for the state of Washington and Idaho is 118 degrees at Ice Harbor Dam, WA and Orofino, ID so we will be watching for this potential closely.

What other impacts are expected?  As mentioned in a previous blog post, here, our region is currently experiencing severe to extreme drought over much of Eastern Washington into the Idaho Panhandle.  The unprecedented heat is not good news for the region.  Wheat and hay crops are already starving for soil moisture, and this upcoming heat will only make the soils drier than they currently are.


And what about fire danger?  Fuel moisture is expected to dry out considerably, reaching record low values for late June.  Fuel moisture comes in different sizes, but all are measures of how dry the grass, twigs, branches, and timber are.  

Forecast 100 hour (branch size) dead fuel moistures based off model data from the NWCC (Northwest Interagency Coordination Center) are shown below.  Red is observed, while blue is the forecast.   The bottom gray line is the minimum value on record.  The plot below is for NE Washington but the same idea applies to other areas of Central and Eastern Washington into the ID Panhandle.  As you can see the red line has dipped near the minimum value several times since mid-May (likely due to the drought).  The blue forecast line is expected to drop fuel moisture to record lows for this time of year.

100 hour fuel moisture (%) for NE Washington.  Red is observed, Blue is forecast from model data


Safety tips

So what can you do to stay safe during this heat wave?  Here are some suggestions
  • Drink plenty of fluids and wear light colored clothes
  • Check on and take care of those vulnerable to heat (children, those with chronic medical conditions, elderly, pets)
  • Stay inside during the hottest times of the day (afternoon and early evening)


Monday, June 21, 2021

Heat is On The Way!

 This week it will be hot and dry for most of the Inland Northwest and the Pacific Northwest. Seeing some of the model guidance and predicted temperatures for this week and next weekend reminded us of the June 27-28 heatwave of 2015 (you can read our blog post here). Let's dive into the comparisons of this heatwave vs 2015 and lay out the expected forecast for this week.

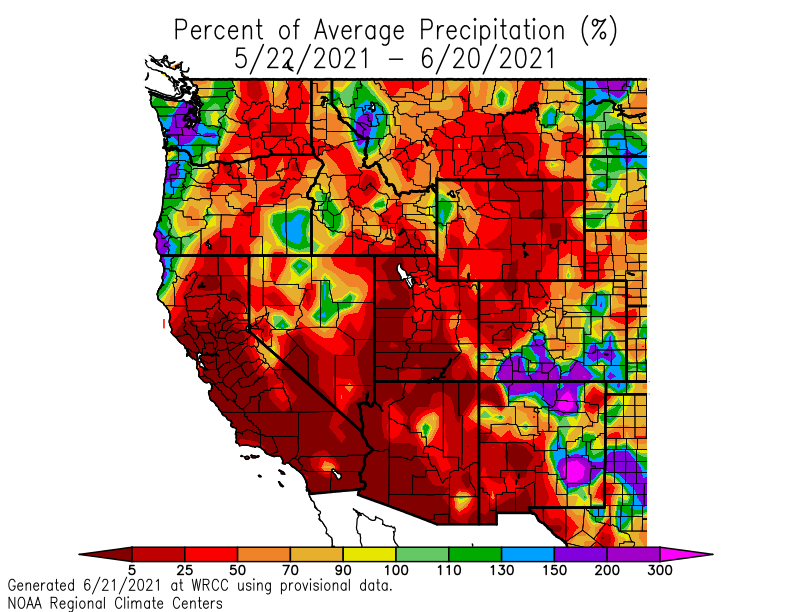
We talked earlier this month about our record dry spring, and in the last 30 days the story of very dry conditions continues. Many locations did receive some good rain from the thunderstorms of June 15th. But the total amount of precipitation in the Inland Northwest has been very low. For many places, around 25% of average or lower.

Here’s a look at our normal precipitation for May and June (since June isn’t complete yet, we went back into May) shown by the brown line, what we have accumulated on the green line, and compared this to 2015 since we know that year saw a hot spell in June. We can see that compared to 2015, this year (2021) is drier for the May - June period.


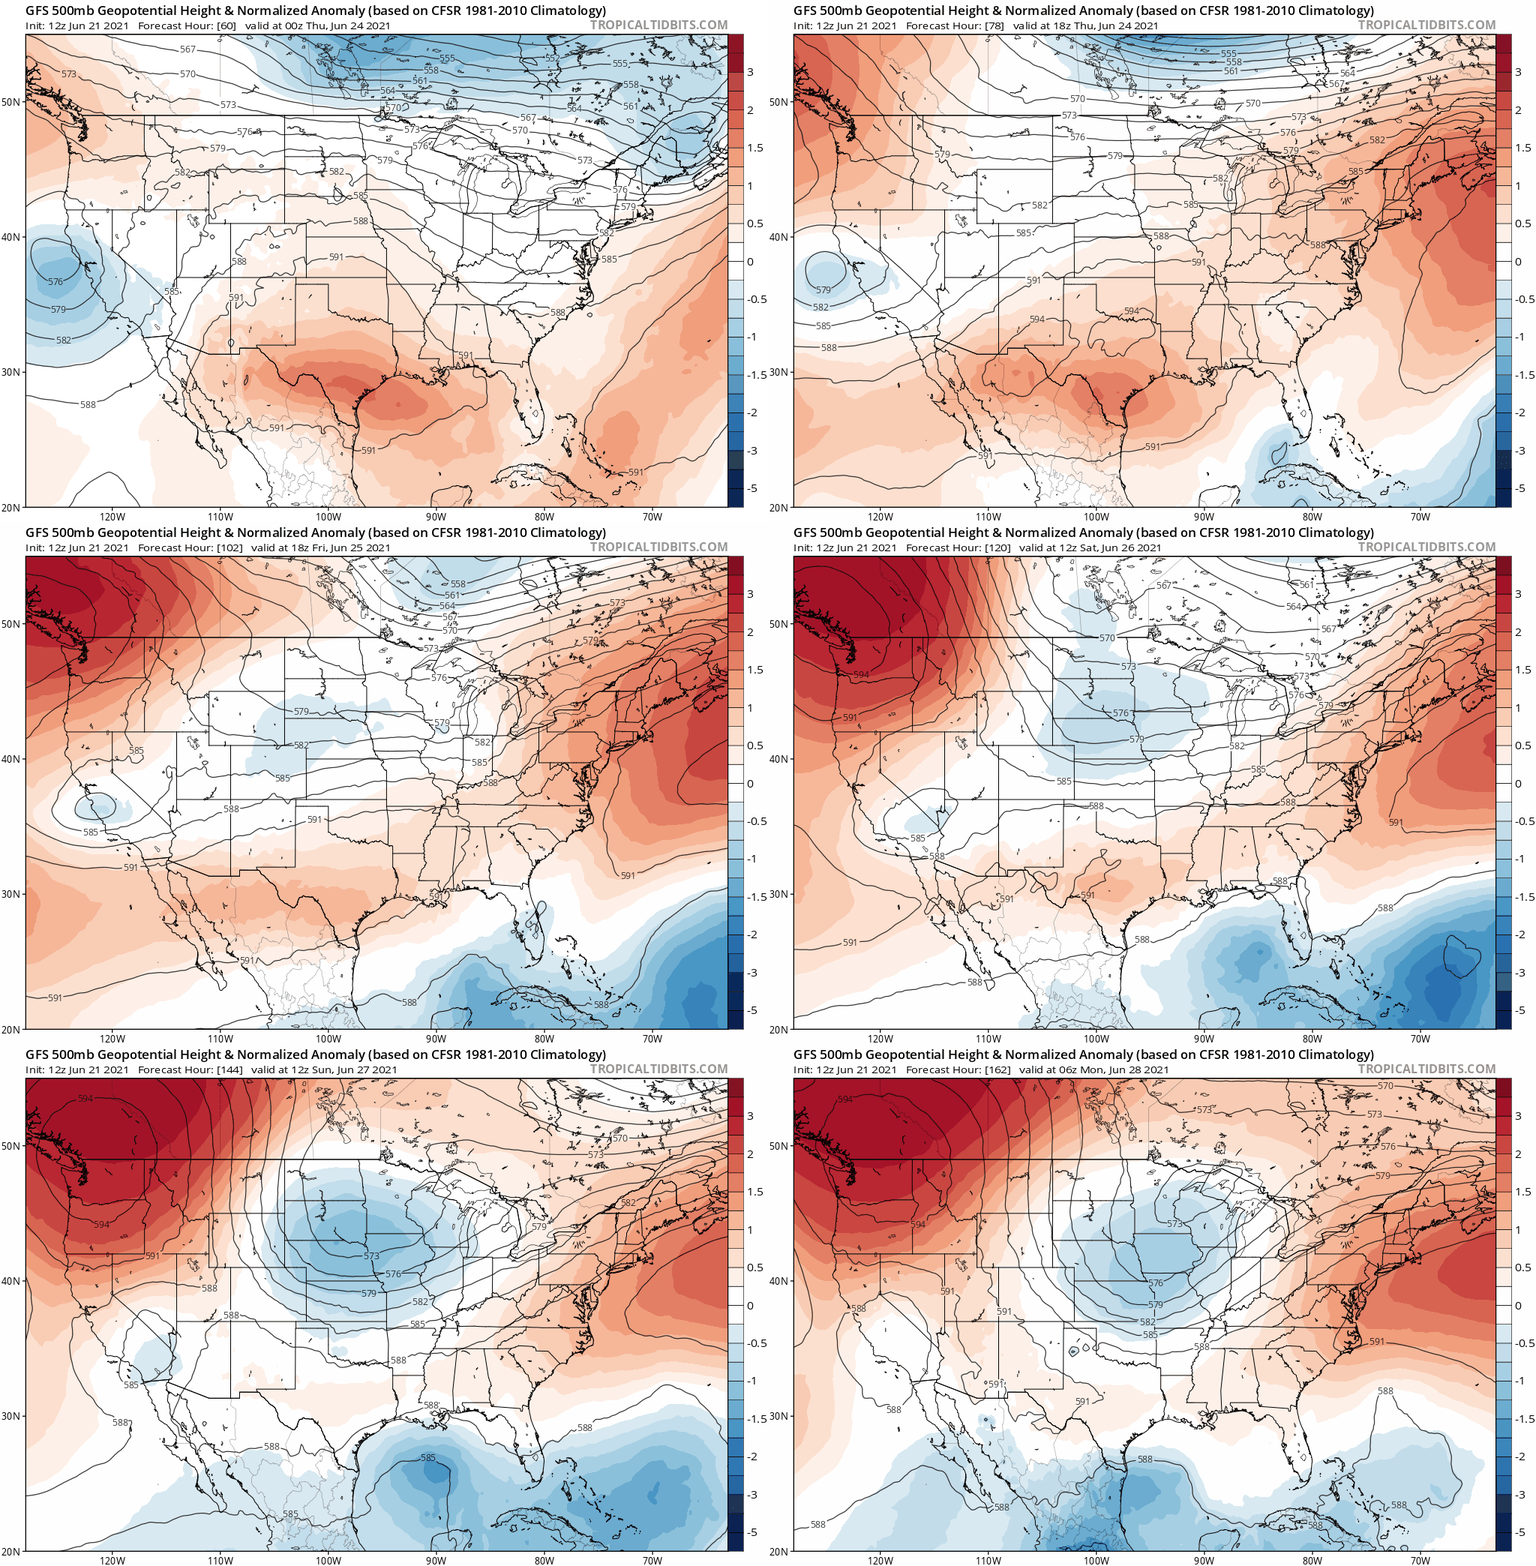
Taking into consideration the very dry spring and now start to summer, along comes a strong ridge of high pressure that will continue to strengthen and settle over the northwest. Below is a loop of the 500mb heights and anomaly from the GFS model, Thursday through next Monday.  For this weekend and early next week, extremely strong high pressure will dominate southwest Canada and the northwest US.

For June in eastern Washington (we’ll use Spokane International Airport as a point of reference), the normal high temperature is 74F. This week, we’re looking at temperatures 10 to 25F degrees above normal, or higher. Yes, higher. By next weekend, daytime temperatures in the 100-105F range are possible. This kind of heat hasn’t been seen since 2015, and thus why we look back to 2015 to see what kind of conditions were going on and what the models were saying then, giving us an idea of what might be to come this week and weekend.

Putting this into perspective, the record hottest temperature ever for Spokane is 108F set on Aug 4, 1961.

Going back to the comparison of 2015, June 27-28 saw temperatures of 102F (27th) and 105 (28th), with upper 90s on days leading up to and after that heat wave. The afternoon of June 28th, the 850mb temperature was 29.6C giving us that max temperature of 105F. What do the models say for our 850mb temps this week and next weekend? Below is the sounding climatology from SPC for Spokane (OTX) for 850mb temperatures. The all-time max 850mb temperature is 31.5C from early August.


Current deterministic model guidance for 850mb temperatures are quite jaw-dropping:


ECMWF:

Saturday - 28.85C

Sunday - 30.85C

Monday - 33.85C

Tuesday - 35.3C

Wednesday - 32.0C


GFS:

Saturday - 28.3C

Sunday - 29.7C

Monday - 33.2C

Tuesday - 34.5C

Wednesday - 33.3C


So all around very hot temperatures for this weekend and into early next week. Leading up to Sunday, the ridge strengthens Friday through Sunday with Sunday looking like the hottest in the next 7 days, which is as far as our forecast goes out at this time.


What about beyond Sunday? Forecast model guidance gets tricky the farther out in time, however strong high pressure patterns are ones that have a tendency to be more persistent, so confidence isn’t completely out the window with the idea that this heat could last into the middle part of next week. Ensemble guidance has also been very consistent in highlighting this strong ridge through early next week. The suite of models are showing 850mb forecast temperatures next Tuesday of 33C - 35C. We have many days between now and then, so these numbers may fluctuate a bit but this is something to keep in mind.


In 2015, we observed 4 days of maximum temperatures 100+F, and in 2020 we observed 3 days (the most is 6 days set in 1928).


The Climate Prediction Center is highlighting a high percentage of excessive heat for June 29-30, next Tuesday and Wednesday. This would suggest our ridge has lower chances of breaking down and better chances of this heat to persist into the middle part of next week.


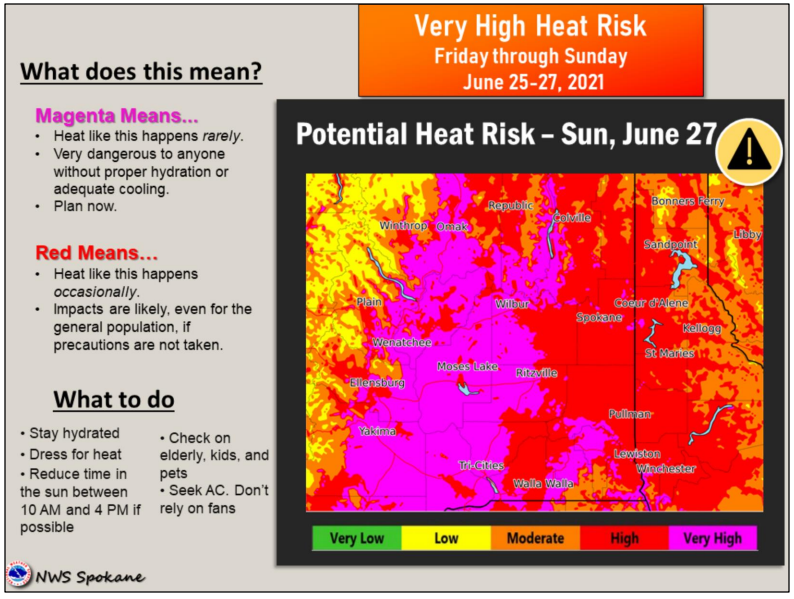
Other factors we have to take into consideration are the overnight low temperatures. With such strong heat during the day, the overnight relief may become less of a relief. Together, this will increase our heat risk for various populations in our region. Currently, here is a snapshot of our heat risk forecast.


Our confidence is fairly high that we will see this prolonged heat last into early next week with this upcoming weekend seeing the hottest temperatures of the year, the hottest since 2015, and the hottest in the next 7 days. After that, it’s possible we will see continued hot temperatures and perhaps slightly hotter?

Wednesday, June 2, 2021

We've never seen a drought like this

 We've never seen a drought like this


It's well known that weather in the western US is drier than in the eastern US.  As such, droughts are more common in the West.  Most of the West is designed to accommodate this drier climate.  The mountains get heavy snow in the winter, which slowly melts off in the spring and summer.  There are numerous dams throughout the West which catch much of the snow melt, using it to irrigate our farmland (as well as generate electricity).  This enables western farmers to grow crops in some rather arid locations.  

Still, there are some areas in the West that, similar to their eastern counterparts, rely solely on the rain and snow to irrigate their croplands.  In the West we call this "dryland farming".  The biggest example of this is typically wheat and barley, but also includes a lot of hay.  The Inland Northwest is known as one of the largest producers of wheat in the US.  


These dryland crops require moisture through the spring and into the early summer.  Grains such as wheat and barley will ripen during the hot summer months and so they don't really require much if any rain at that point until they are harvested in late summer.  This matches the usual rainfall patterns we see here in the Inland Northwest.  But not this year.

Rainfall this spring hasn't just been light, it's been nearly non-existent.  We haven't seen anything like this before.  Spokane just finished it's driest February through May ever.  EVER.  Records for Spokane go back to 1881.  That means this was the driest spring in 140 years!  And it wasn't just Spokane.  The dark red area in the image below shows all of the areas that have had their driest February-May on record.


As you can see, it's been dry over much of the Northwest this spring, but the Inland Northwest has been the epicenter of this dryness.  The three month period of March through May was the driest for many other locations in the Northwest.


So the natural question is "what caused this drought?".  The answer isn't straightforward and probably incomplete given our current understanding of weather and climate.  One contributor that we are aware of is La Nina.  To which you may be saying "I thought La Nina meant wetter than normal conditions for our area", and you would be correct.  Here's a diagram showing the basic jet stream pattern for a typical La Nina that you may have seen before:


The purple and orange lines are meant to represent the variable jet stream patterns we normally see during a La Nina winter/spring.  The purple line shows a colder phase of the jet stream, diverting up into Alaska and then bringing colder but drier air into the Northwest US.  But then the jet stream will also at times follow the orange line, bringing Pacific moisture into the Northwest.  The problem is that for the spring of 2021, we've seen a LOT more of the purple jet stream, and not so much of the orange jet stream. 

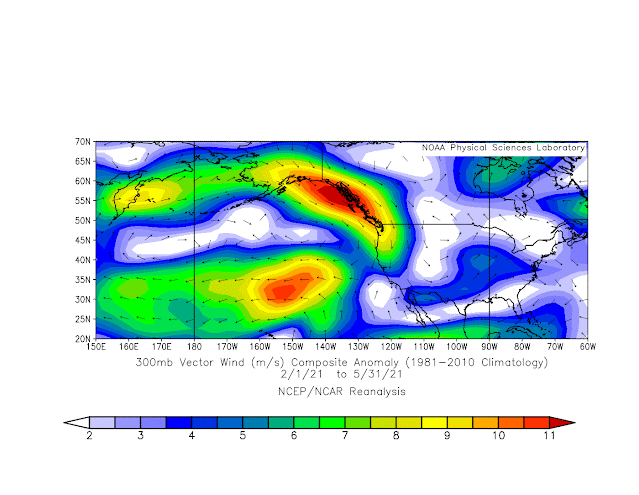
Note in the image above the big H and the blocking High Pressure in the Gulf of Alaska.  Here's the air pressure anomaly at about 18,000 feet in the atmosphere from the Feb-May period this spring.

What this shows is that the air pressure in the Gulf of Alaska has been higher than normal this spring.  This compares very well with the idealized La Nina image previously shown with the Blocking High in the Gulf of Alaska.  So this looks like what we would expect for a La Nina winter/spring.

But now here's the jet stream anomaly for this past spring:

Do you see that ribbon of bright colors along the Canadian west coast?  That shows that the jet stream this year has been coming from the northwest a lot more and a lot stronger than usual.  Note that those bright colors extend all the way back to Alaska, across the north Pacifc and Kamchatka Peninsula.  In other words, the "purple" jet stream has been doing its thing during a La Nina winter like it should.

But then look at the other area of bright colors in the image above, out in the eastern Pacific.  Those show that the jet stream across the Pacific has been much weaker  and infrequent than normal.  So the "orange" jet stream that is supposed to bring the moisture, hasn't been doing its job this spring.  

The result is that we've been getting a lot more of the "purple" jet stream from the northwest (which is a dry weather pattern), and not nearly enough of the "orange" jet stream from the Pacific (which is a wet weather pattern).

Is there any hope of this pattern changing?  Officially, the Climate Prediction Center declared the 2020/21 La Nina over.  That's not to say that our weather pattern will necessarily change, especially since we are heading into the typical hot dry summer season.

Here's the computer forecast for the June-July-August season for temperature and precipitation.  They call for a warmer and drier than normal summer overall all of the western US.  


But this of course is a computer forecast.  And you may be wondering if the computer forecasts correctly predicted our record dry spring.  That's a good question, and the answer is no, the computers never saw it coming.  Here's the forecast made back in February 2021 for the Feb-Mar-Apr timeframe.  That area of light blue in the Inland Northwest shows that the computer actually expected that we would see normal or possibly wetter than normal conditions for our area, which agreed with the usual La Nina pattern.


Sunday, May 16, 2021

Will changes this week bring any drought relief?

As was mentioned in the previous blog post, found here, a record dry Spring has been experienced in many locations so far.  But will the changes this week bring some rain?  We will get to that later but first let's take a look at a few updated drought maps and an imminent cool down.


Drought update

Here is a look at the latest % of normal precipitation map over the past 90 days


Some of the driest areas relative to normal since February 1st have been from the Columbia Basin into the Spokane area. The driest Feb 1st-May 15th period on record has occurred at some locations including Spokane and Davenport.  Here are a few graphs showing what has fallen so far versus the normal.  

Spokane Airport has received 1.31" of precipitation since February 1st; normal precipitation is 5.20".

Spokane observed precipitation since Feb 1st.  Green line (observed) vs brown line (normal)

Davenport: Observed: 0.60" Normal 4.21" 

Davenport observed precipitation since Feb 1st.  Green line (observed) vs brown line (normal)

Let's look at one more site - Ephrata.  The 2nd driest period has been recorded with only two days of light precipitation since February 15th.

Ephrata: Observed 0.36" Normal 2.24"

Ephrata observed precipitation since Feb 1st.  Green line (observed) vs brown line (normal)


The dry conditions this spring have not been good for the spring wheat crop.  The map below shows planting areas of spring wheat (by county) with drought areas overlayed


And this is a big increase over the past 3 months because of the dry weather.

Changes ahead

So our region needs some rain!  The weather pattern this week will change as low pressure sets up near the region.  We are confident that temperatures will cool significantly Tuesday and Wednesday with highs Wednesday dropping into the upper 50s and 60s.  Here is one model projection showing the cooler than normal temperatures over the area.

12z/May 16th GEFS 2 meter temperature anomaly (deg C) valid 5 PM PDT Wednesday, May 19th

But will we get some rain?  It looks like there will be an increasing chance mid to late week as bands of showers rotate counterclockwise around a low over Oregon.  Below is one model showing the low position on Wednesday with the green areas showing elevated moisture content and thus the greatest chances of showers over the Idaho Panhandle and Cascades.

12z/May 16th GFS 500mb heights and 700-500mb Relative Humidity valid 2 PM PDT Wednesday, May 19th

On Thursday into Friday the low drops south, but bands of showers rotating around the low may give parts of our region additional opportunities for some rain.

12z/May 16th GFS 500mb heights and 700-500mb Relative Humidity valid 11 PM PDT Friday, May 19th

There is high uncertainty as to which areas get rain, and how much.  But at least it's a change and an opportunity for rain.  Stay tuned for forecast updates this week as we monitor the track of the low and the showers associated with it.  


Saturday, May 8, 2021

Record dry

Has it seemed dry to you this Spring?  If you said yes, you are correct!  In this blog we talk about the dry conditions, which have been record dry in some areas, and what this may mean heading into summer.

First let's look at March and April % of normal precipitation, courtesy of WestWide Drought Tracker

% of normal precipitation March-April 2021

The entire region has been drier than normal, especially in the Columbia Basin (5-25% of normal).  In fact, many areas finished in the top 5 for driest March-April periods with some records noted below.


And if we go back to February, record dryness is noted for portions of the Upper Columbia Basin into the Spokane area.

Percentile ranking for precipitation February-April 2021

While it has been record dry in some areas in the past 2-3 months, are we in a drought?  To help answer that question we need to understand the big picture.  

One way is to look at precipitation anomalies over a longer period of time.  Meteorologists often like to look at what has happened beginning October 1st.  This is when fall storms begin to invade the region.  Below is the % of normal precipitation since October 1st, also referred to as the beginning of the "Water Year" (courtesy of High Plains Climate Center).


Again, the Columbia Basin sticks out as the driest region, along with drier than normal conditions over NE Washington and North Idaho.  The Cascades, Okanogan Valley, and Okanogan Highlands are in better shape.

Another factor is mountain snow pack.  Snow that accumulates over the mountains during the fall and winter melts in the spring and feeds many area rivers and streams, providing water supply into the summer.  Typically snow pack peaks around April 1st, with the graphic below showing near to above normal snow pack.


The snow has been coming off the mountains a little quicker than normal over Eastern WA and North Idaho as noted by the latest mountain snow pack % of normal as of May 8th.


Taking into account the recent dry conditions and the mountain snow pack, the Climate Toolbox has several useful ways for plotting data including soil moisture.


As the map shows, much of the Wenatchee area, Columbia Basin, Palouse, LC Valley, and portions of North Idaho are about as dry as it can get for this time of year ranking in the bottom 2% of terms of soil moisture.  The snow pack is helping out the mountains especially the Cascades.

So what does the latest U.S. Drought Monitor show?  

US Drought Monitor as of May 6th, 2021 for Washington and North Idaho


Moderate (D1) drought is depicted over much of Eastern Washington and North Idaho with D2 (Severe) drought over much of the Columbia Basin.  Yellow shading (D0) isn't drought but rather abnormally dry conditions.

What does the long term precipitation outlook offer?  The Climate Prediction Center is calling for elevated odds of drier than normal conditions over the region.

CPC precipitation outlook for May-July 2021 issued April 15th, 2021

This does not look good! Elevated odds of drier than normal conditions may result in a continued expansion and severity of the drought. The good news is that the mountain snow pack should allow for adequate water supply this summer over much of Central Washington. Eastern Washington and North Idaho water supply isn't looking as good.  The link to the latest forecast issued by the NW River Forecast Center can be found here

NWRFC Water Supply Forecast valid April-September 2021

Lastly, what does this mean for fire season?  Often the severity of fire season around this area is related to number of critical weather events that set up each summer, such as the Labor Day wind storm last year.  Amount of lightning can also play a role depending on how dry the landscape is when lightning occurs.  While these specifics can be tough to predict months out, the recent dryness is a concern for grass fire potential across the Columbia Basin and portions of Eastern Washington heading into June.


The latest fire outlooks from NIFC (National Interagency Fire Center) can be found here.  These are updated on the 1st of each month.


Friday, March 26, 2021

Wind Storm This Weekend


As we talked about yesterday, we’re looking ahead to our late weekend strong wind event. Let’s dive right in with some model talk! Then stick around for what this will mean for impacts to those of us that live here. Our confidence is growing with how this event will unfold and the impacts we’re expecting.


First, model talk


In recent memory our big wind storm of Jan 13 is most notable as far as wind speeds and damage. Then there was the Nov 2015 storm that caused a lot of widespread damage as well. Many people have asked “How will this storm compare to those two?” and we’re ready to dive into talking about that.


Looking at the surface analysis for the Jan 13, 2021 event we can see the surface Low pressure up in southwest Alberta, Canada and a surface High pressure just near Portland, Oregon. The image below has been annotated to highlight the surface low pressure, 984 mb, and the high pressure, 1029 mb. The gradient of 45 mb is quite strong over this distance and gives an estimate of the wind speed blowing from High to Low pressure.


One of the strongest wind gusts for Jan 13 was the 71 mph at Spokane International Airport.


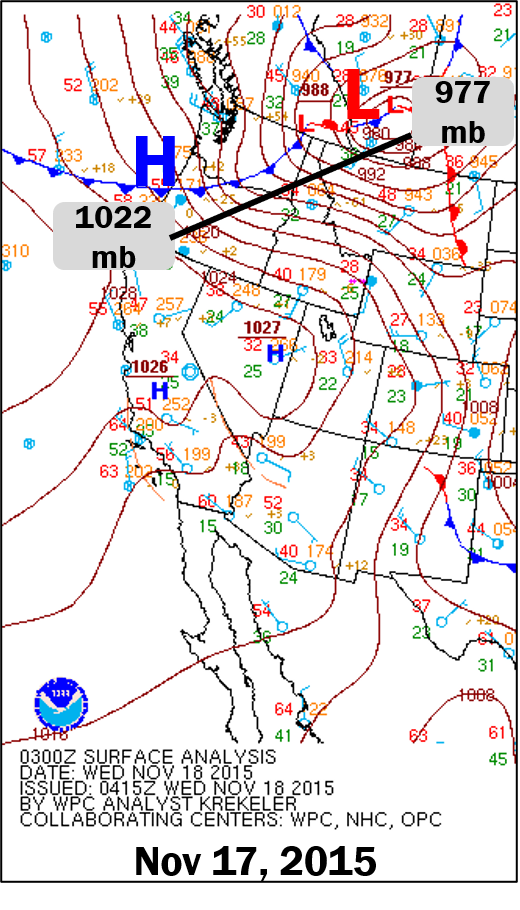
The next most recent high wind event that left quite a bit of damage across our region was Nov 17, 2015. Similarly enough, the max wind gust at Spokane Airport for this event was also 71 mph. Slightly different events that unfolded, but that was the max wind gust. Below is the surface analysis image annotated with the low and high pressures as well. The surface low in southwest Alberta had a low pressure of 977 mb and the surface high in western Oregon had 1022 mb for a surface pressure. This was a difference of 45 mb once again.

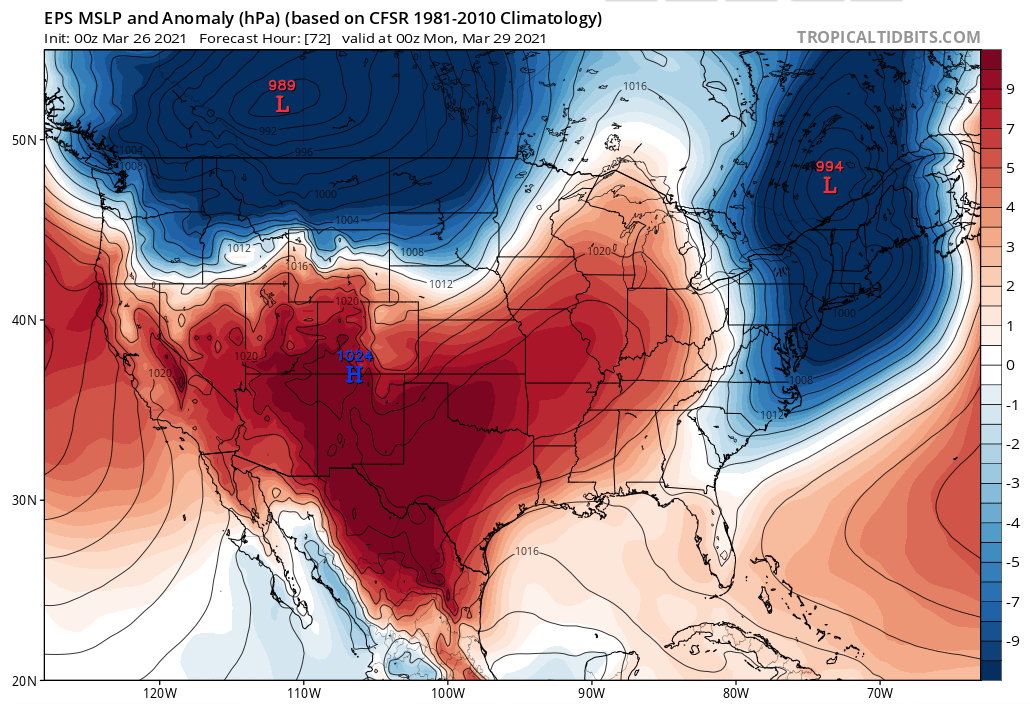
 So now that we are nearing our Sunday night/early Monday wind event, what do the models look like? We’ll look at three different models: European ensemble (EPS), GFS ensemble (GEFS) and Canadian ensemble (GEPS) for comparison sake. First, here’s the European ensemble:


The mean MSLP low is around 989 mb over southwest Alberta and the high is 1024 mb over southwest Oregon, which would give a gradient of 35 mb. Among the various ensemble member forecasts, the surface low has been showing up in relatively the same place, clustering in a way. The clustering shows good agreement among all the different models. This is good! This helps build confidence in the forecast.


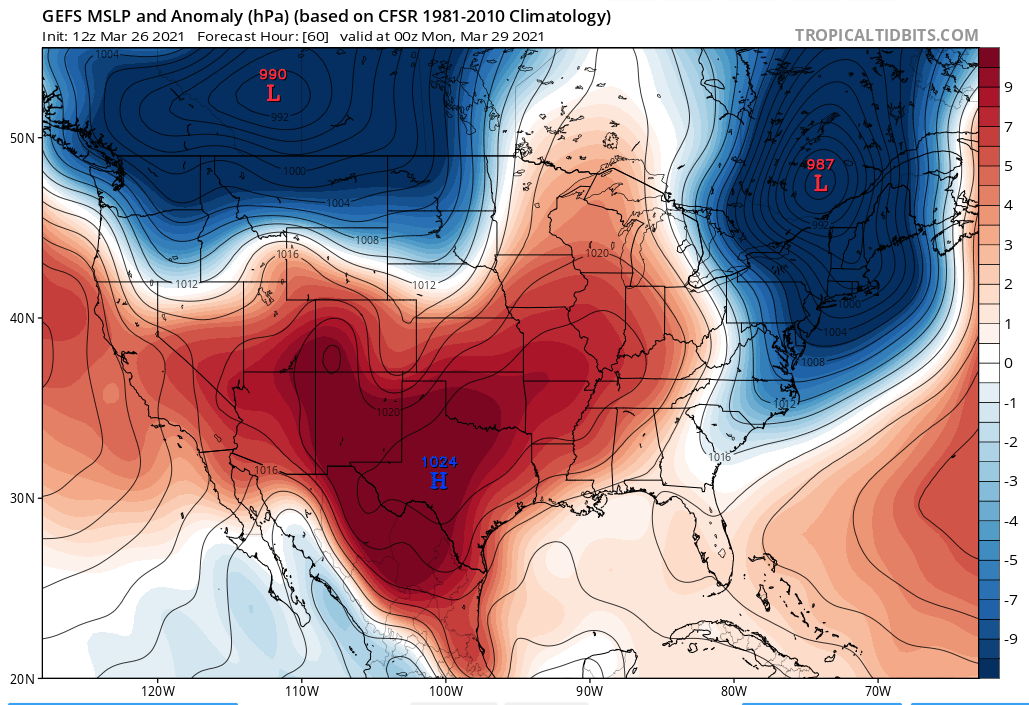
The image below shows the GEFS version of the mean MSLP. The surface low is being positioned in southwest Alberta again. The low is around 990 mb and the high is 1020 mb over southwest Oregon. So our gradient would be 30 mb.


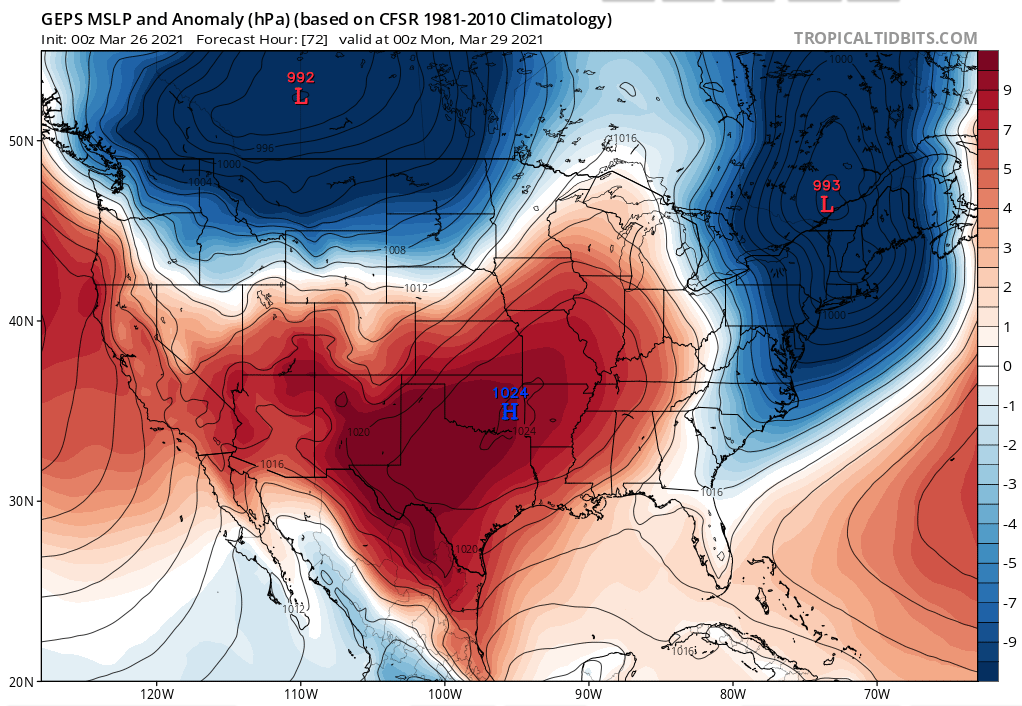
The GEPS version is quite similar to the previous two models. Southwest Alberta low of 992 mb and southwest Oregon high of 1024 mb, which would give a surface gradient of 32 mb. 


Given all of this, what can we say about the upcoming wind event? This wind event does NOT look to be as strong as those from earlier this year and in 2015, at least as of now.


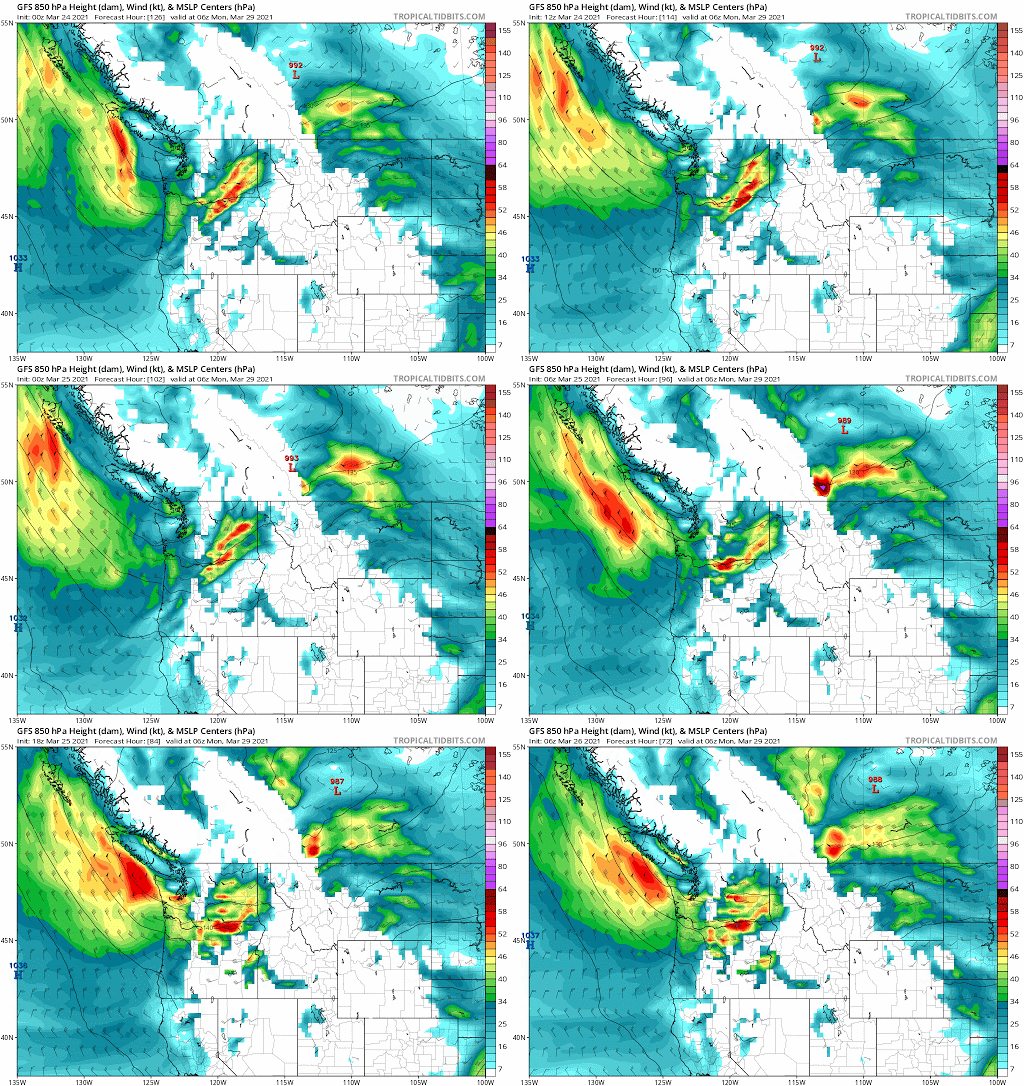
So, we mentioned that we like to look at how the models trend and perform. These are just a select few snapshots of model comparisons. Let’s look at the GFS first. The time stamp we are focusing on is 06z Monday which translates to about 11 pm Sunday night when we will be seeing the peak wind gusts. So as the model has been trending, the winds at 850 mb (which is about 2000-3000 feet above the ground) are showing 45-55 mph across the Columbia Basin and eastern Washington.


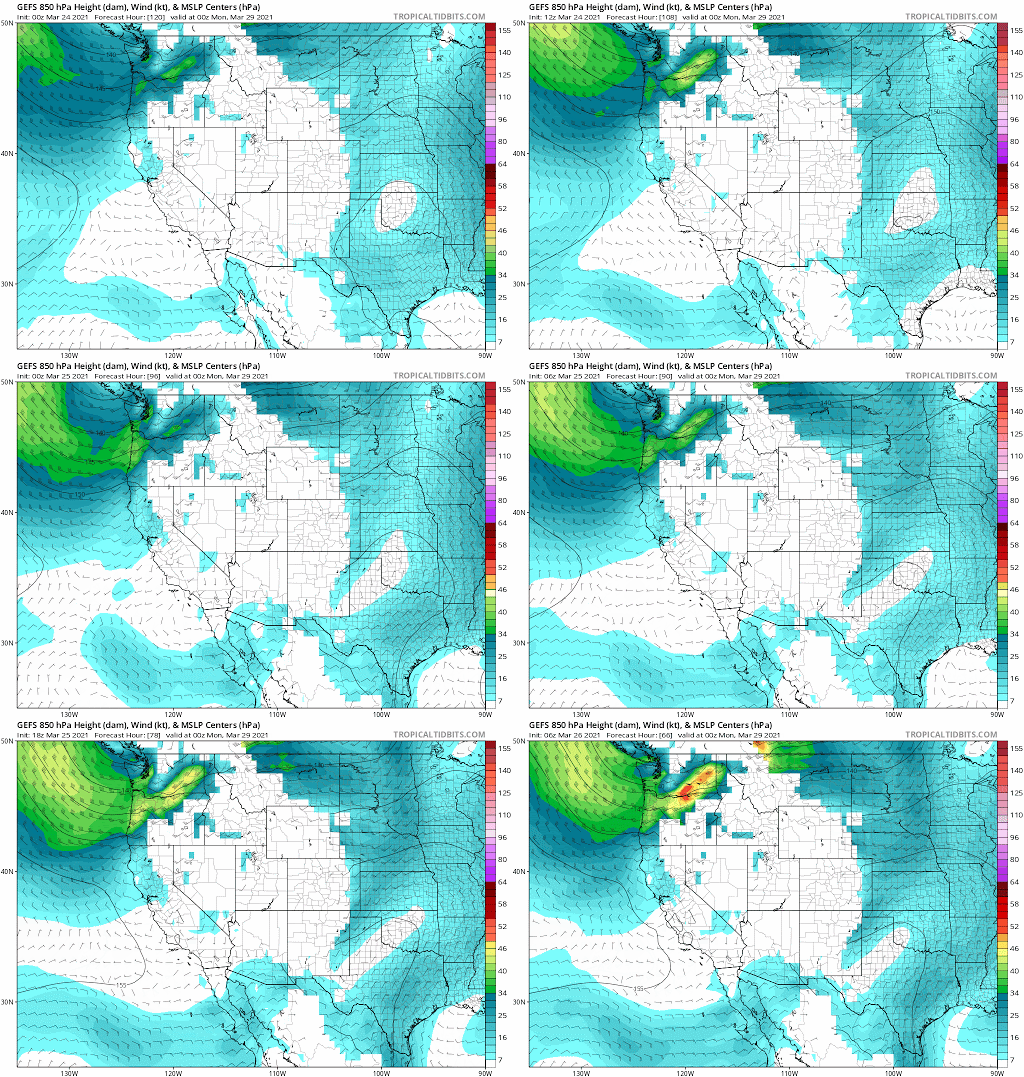
 While a snapshot of a model is helpful, the ensemble version gives us a better idea of more members of said model and how it is all trending. More of a consensus, if you will. Below is a loop of how the GFS ensemble. Showing much of the same as the GFS loop, this is highlighting increasing potential for stronger winds at 850 mb, 45-55 mph and maybe even closer to 60 mph.


That’s a lot of science, so what do I do with that?


You may have asked yourself that, and that is a valid question. As we look at all the model output and try to put together a forecast, we take into consideration what this will mean for folks who live here. What kind of impacts this will create, hazardous weather, and trying to pin down a time is just as important as it is difficult to predict.


Strong winds


Our confidence is growing with each model run that we are analyzing and it looks promising the Columbia Basin and Palouse into the Idaho Panhandle will be the areas that see the strongest wind gusts. Winds will begin increasing through the day Sunday with our cold frontal passage expected during the evening and late night Sunday, giving us the time period of 6 pm - midnight for our strongest winds.


Wind gusts of 45-55 mph looks reasonable with growing potential to see locally higher values in select locations.


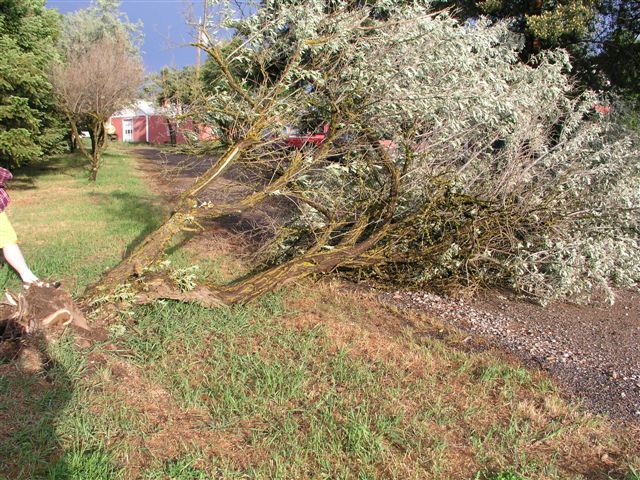
Image showing tree damage from strong winds (not from this event).


Blowing dust


The image above is not a current image but one from a previous event. This is to illustrate the potential for blowing dust Sunday.


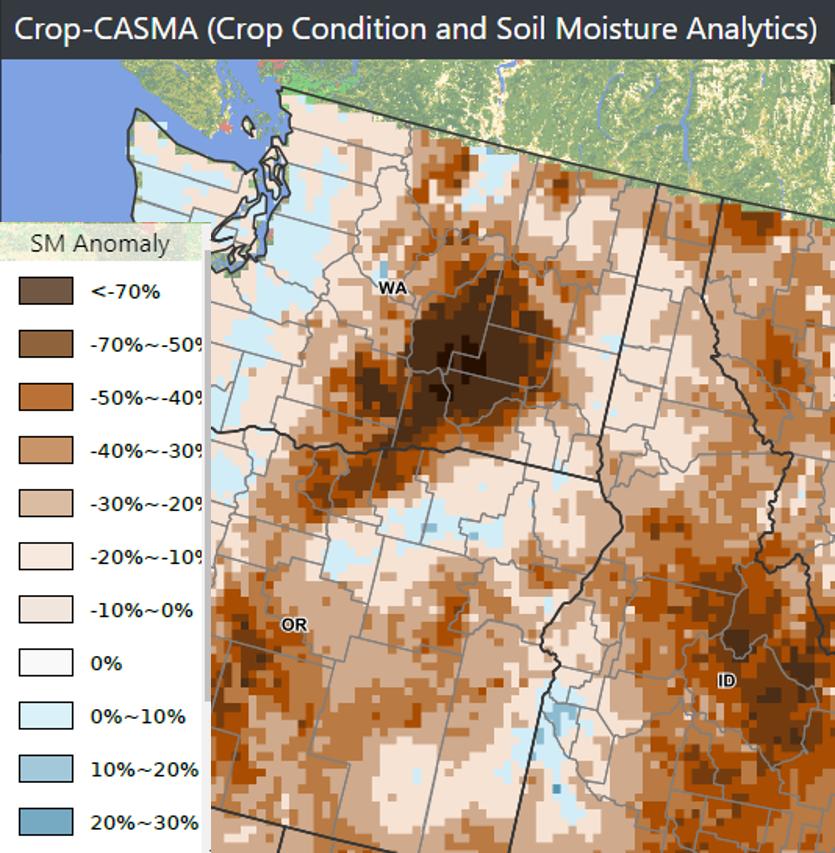
It’s getting to be that time of year when agriculture activity is increasing and fields are being prepped for planting. So much of the central and south-central part of Washington has seen a lack of appreciable precipitation in the last few months, so it is no surprise that this area will be dry and could see blowing dust with these strong winds.  The below image shows crop conditions and soil moisture analysis. It shows just how dry the soils are across south-central Washington.


Stay connected for any forecast updates going through the weekend!