Monday, September 11, 2023

Will Strong El Niño Impact Our Fall Weather?

 As some of you may have heard, El Niño is developing in the Central and Eastern Equatorial Pacific Ocean.  Here is a look at the latest Sea Surface Temperature Anomalies, showing the area of warmer than normal water along the Equator.

Sea Surface Temperature Anomalies (degrees C) averaged from Aug 6th-Sept 2nd, 2023

If these anomalies persisted into the winter, we would be looking at a strong El Niño event.  The Climate Prediction Center is calling for greater than a 60% chance of a strong event.  So with the water already so warm, does this mean we can expect an impact from El Niño this fall?  Great question.

We went back to take a look at previous events in October and November since 1980 where we were already in a Strong El Niño, or heading into one for the upcoming winter.  

Let's start with temperature.

Previous Strong El Niño Events - October and November Temperature Anomalies

There have been 5 cases since 1980 of this scenario, with the closest matches being 1982, 1997, and 2015 where we were already in a moderate or strong El Niño at this point.  Green and blue colors mean cooler than normal, while yellow, orange, and reds warmer than normal.  As you can see quite a bit of variability with even some cooler than normal fall's.  

You may be asking with climate change, should we put more weight into the most recent event (2015) which was warm?  Are we seeing warmer October's and November's with time?  Let's look at a couple climate divisions over the region to see if there is a trend.

Northeast Washington October-November Average Temperature Trend


East Slopes of the Cascades October-November Average Temperature Trend


As we can see, there is a little to no trend in temperatures for October and November.  

So past strong El Niño events as well as long term trends are not telling us much about how this October and November will play out.  What other sources do we have?  The climate models are favoring a warmer than normal October and November according to the NMME (National Multi Model Ensemble).


NMME Temperature Anomaly forecast for October 2023

NMME Temperature Anomaly forecast for November 2023

What is the official outlook calling for from the Climate Prediction Center?  Some tilting of the odds towards warmer than normal conditions from October-December (Note: 2 month outlooks are not produced).
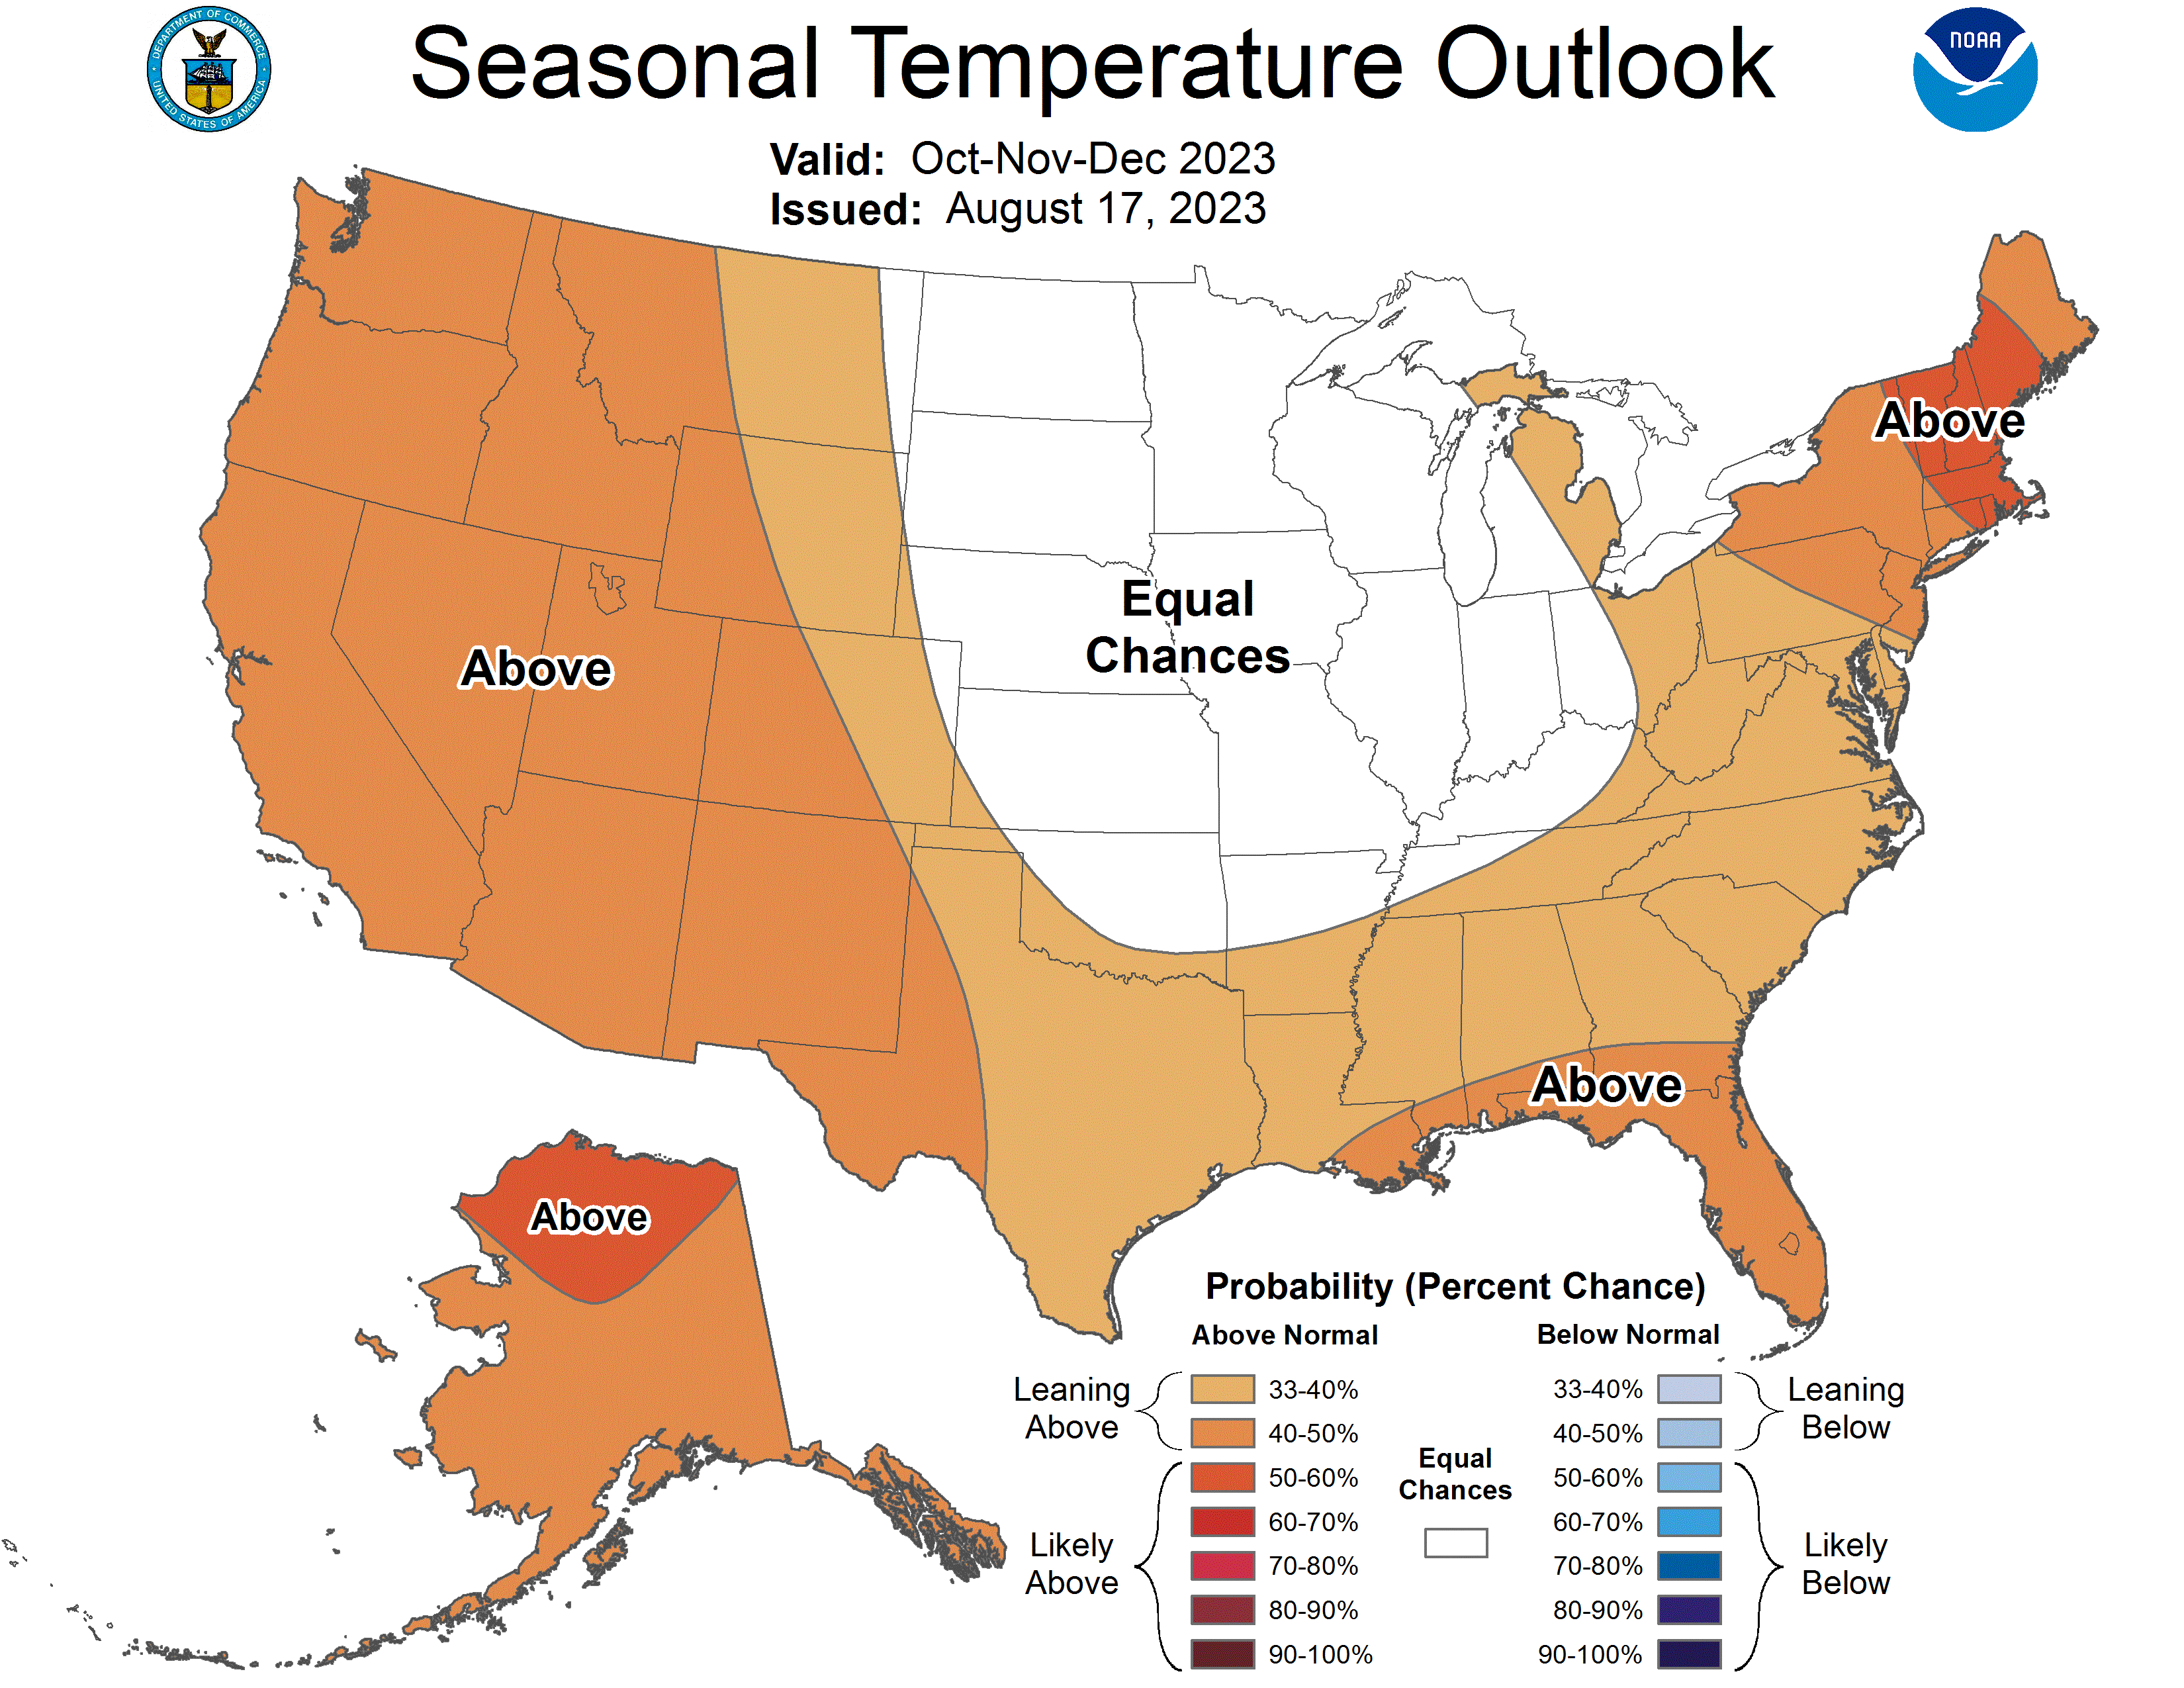


Climate Prediction Center Temperature Forecast for October-December 2023, issued August 17th

Conclusion for Oct-Nov Temps: While previous strong El Niño events as well as trends are not telling us much, the odds are tilted towards warmer than normal conditions.

What about precipitation this fall?  Again we will begin with previous strong El Niño events to see what has happened in the past.


Previous Strong El Nino Events - October and November Precipitation Anomalies


Precipitation shows less variability when compared to the temperature maps, with all five events giving us near normal amounts with minor location variability. What about long term trends in precipitation?

Northeast Washington October-November Average Precipitation Trend

East Slopes of the Cascades October-November Average Precipitation Trend


Similar to temperature, little to no trend.

What are the climate models showing?  Here again is the NMME for October and November.

NMME Precipitation Anomaly forecast for October 2023

NMME Precipitation Anomaly forecast for November 2023

There is a weak signal towards drier than normal conditions, especially in October.

Finally, what is the Climate Prediction Center calling for?

Climate Prediction Center Precipitation Forecast for October-December 2023, issued August 17th


Some tilt in the odds towards drier than normal conditions.

Conclusion: While previous Strong El Niño events have generally brought normal precipitation for October and November, the outlook shows odds slightly tilted towards drier than normal conditions.

Now that we have finally made it through November in this blog, what about the winter?  Well that is a topic for a later blog post.  But here is a little teaser...typically our El Niño winters are mild.


Monday, August 14, 2023

Heat, Fire and Smoke, Wind, Then Rain?

The hottest temperatures of the summer are imminent, with most towns reaching the triple digits.  How long will it last?  And what weather concerns will we face as we transition away from the heat?  Is there any rain in sight?  In this blog we will address these questions.

First let's take a brief look at the weather pattern causing the heat.

00z/Aug 14th Grand Ensemble forecast of 500 mb heights and temperatures valid 5 AM PDT Aug 14th

As you can see from the map, a large area of high pressure encompassing Washington, Oregon, and Idaho.  It looks like this ridge will stick around for several days, giving the Inland NW an extended period of hot weather.   But if you are not a fan of hot weather relief is in sight.  The weather pattern will shift this weekend, as indicated by the forecast weather pattern for Saturday shown below.

00z/Aug 14th Grand Ensemble forecast of 500 mb heights and temperatures valid 11 AM PDT Aug 19th


High pressure shifts into the central part of the US with a broad trough along the coast extending into the Inland NW.  

The forecast temperatures reflect these trends, going from triple digit heat this week down into the 70s and 80s by early next week.

NWS High Temperature Forecast issued 230 PM August 14th valid Aug 15-21th, 2023

How do these temperatures compare to the June 2021 record heat wave?  Not even close when several locations went above 110F, including 120F in Hanford, WA.

Map of high temperatures from June 29th, 2021

The nights of mid-August are also longer compared to those of late June.  But that doesn't mean this heat wave should be taken lightly, as Excessive Heat Warnings and Heat Advisories are out for the region.


NWS Heat Warnings and Advisories as of noon, August 14th


Some daily record high temperature records will be in jeopardy as well.  Be sure to stay safe in the heat including:
  • Wear sunscreen
  • Drink plenty of water
  • Avoid alcohol/caffeine
  • Wear a hat and sunglasses
  • Wear light clothing
  • Find shade and take breaks
  • Cool off in air conditioning when possible

Fire Weather Concerns This Week

Looking at satellite imagery Monday afternoon showed several active wildfires producing smoke across Oregon and southern British Columbia, with a few fires also over Washington, Idaho, and NW Montana.  

Aug 14th (1256-231 PM PDT) Satellite Imagery showing several smoke plumes around the region.


The hot and dry weather will likely yield increased smoke production from area wildfires over the next couple days.  

The second concern is the wind.  Typically in weather transitions with falling temperatures, the result is wind and this week is no different.  The peak of the fire weather concerns currently looks to fall on Thursday as breezy west to southwest winds develop.  Here is the forecast wind gusts for the region for the late afternoon.


While these winds may not seem too noteworthy, when combined with the hot and dry conditions yields a critical fire weather combination.  The HDWI (Hot Dry Windy Index) is showing very high chances of reaching or exceeding the 90th percentile (which means top 10% of hot/dry/windy combination).  This means that 1 of at least every 10 days doesn't see conditions this extreme.

Probability of Hot, Dry, Windy Index exceeding 90th percentile

Thus Thursday has the potential for rapid fire spread with any new or existing fires.  Please use extra caution!

Outlook for Next Week

Not only will the trough next week bring cooler temperatures, models are showing a favorable setup for some precipitation as well.  The latest 6-10 temperature and precipitation outlooks favor normal temperatures and elevated odds of above normal precipitation

Climate Prediction Center 6-10 day temperature and precipitation outlook issued Aug 14th, 2023 valid Aug 20-24th, 2023


Saturday, May 13, 2023

Strange, Odd Weather Pattern

The Inland NW is currently heading into a strange weather pattern.  There are several aspects that makes the upcoming pattern unusual, and odd.  Let's start with a look at what is going on out there from 22,236 miles above the Earth's surface.

Below is Water Vapor Satellite Imagery, which is a measure of moisture in the atmosphere.  Currently there are dark reds over Washington, most of Oregon, and north Idaho which means very little moisture out there.   

GOES 18 Low Level Water Vapor Channel 230-520 PM PDT May 13th, 2023

Also of note is a low spinning over Nevada and Utah.  That is so far away, typically not something we need to worry much about.  More on that later.

We now turn out attention to Canada.  Why Canada?  The forecast high pressure over the country is very noteworthy, and shown to be highly anomalous in the red shaded area.  The graphic below compared the model forecasts to all other forecasts for this time of year from 2000-2019.  Anything in red means the forecast is for something stronger than what has ever been forecast by the model in that 20 year period.

NAEFS Mean Geopotential Height (500 mb) and Return Interval.  Dark Red means values fall outside those that have been forecast by the model between 2000-2019.  

In fact, the strength of the ridge will play a role in the track of the low over Utah and Nevada!  We will get to that in few minutes, but let's take a quick detour to talk about what is going on in Canada.  What is going on under this anomalous high pressure?  Very warm temperatures which are aggravating wildfires in the country.

Here is today's wildfire map showing several active wildfires.

Map of current fires over western Canada and the Northwest US

Here is a link to the above map.  Orange fire icons means the fire is over 1,000 acres.  Note most of the local fires are from prescribed burns.

Under this warm ridge, temperatures are abnormally warm in Canada with many areas in the upper 70s to mid 80s, which is comparable to many readings we are seeing locally.

Map of 5 PM Temperatures May 13th, 2023


NESDIS recently released a two-minute video recapping the Canadian wildfires through May 11th which have burned around a million acres.

With the strong high pressure and warm temperatures over Canada, we will probably be seeing more stories related to the Canadian wildfires in the coming weeks unfortunately.

Alright back to our region.  How will the big high pressure over Canada and the low over Nevada and Utah influence us?  We now turn to model forecasts which are in good agreement showing a strange scenario playing out over the next four days. 

18z GFS forecast of 500mb heights and 700-500mb Relative Humidity through Friday, May 19th 2023.


The low initially moves from east to west (opposite of what typically happens), due to the very strong high pressure over Canada that takes on a west-east orientation forcing the low to track west.  Then it lifts north into Washington and Oregon on the back side of the high pressure.  Strange.

Given the trajectory of this low from the south, there will be an increased "mugginess" to the air as moisture increases over the region while our temperatures are still well above normal.  Here is a look at available moisture in the atmosphere from one model depiction.  The dark green means there will be plenty of moisture in the atmosphere come Monday, Tuesday, Wednesday, and Thursday.

Precipitable Water Standardized Anomaly from 18z GFS Model valid May 14-19th, 2023


What will this equate to weather wise?  A chance of thunderstorms each day Monday through at least Thursday.  Below is Tuesday's chance of thunderstorms per the NBM Model.  It's showing a 40-50% chance over the mountains, northern Washington, the Idaho Panhandle, and Lewiston area.  Over the Columbia Basin a 10-20% chance.

NBM (National Blend of Models) forecast of thunderstorm chances on 11 AM - 11 PM PDT Tuesday

What are the main hazards from these storms?  For that let's look at the forecast conditions of the atmosphere on Tuesday.

18z GFS Forecast Sounding for Spokane, WA on Tuesday, May 16th at 5 PM PDT

The red circled area has caught our attention.  Winds are rather weak (15 MPH or less) through a very deep layer of the atmosphere.  This means storms will be slow moving, and capable of producing brief very heavy rainfall, or flash flooding.  Stay tuned for updates as this strange and odd weather pattern plays out in the coming days.


Sunday, April 23, 2023

Significant Warming This Week

***Updated Apr 24th with new forecast numbers*** 

Are you ready for warmer temperatures?  A big change in the weather pattern is coming, bringing the warmest temperatures of 2023 so far for many locations.  First lets take a quick peak of what has been going on this spring, and why it has been so cold.

Most days this spring have brought below normal temperatures. Below is a plot of temperatures in Spokane and Wenatchee since March 1st.  The blue bars are observed values, with the brown shaded area normal values.  As you can see, most days have been cooler than normal, with observed temperatures the past 30 days showing little in the way of warming despite the normal temperatures increasing.

Spokane (GEG) temperatures since March 1st.  Blue bars are observed.  Brown shading is the normal range.  Top red line is record high values, while bottom blue line is record low values.
Wenatchee (EAT) temperatures since March 1st.  Blue bars are observed.  Brown shading is the normal range.  Top red line is record high values, while bottom blue line is record low values.

Why has it been so cold? There has been a persistent trough over the region as noted by the dark purple shading on the map below over the Pacific Northwest.

500mb temperature anomaly March 1st-April 19th, 2023

Significant changes are in the forecast.  Here is a loop showing the weather pattern this week, with strong high pressure forecast to build over the western US, which will bring the warmest temperatures of 2023 so far.

Forecast weather pattern this week - showing 500 mb heights and anomaly through April 30th, 2023

How confident are we in the warming trend?  For this answer our forecasters like to look at what are called "Box and Whisker Plots".  This sophisticated method takes in what are called ensemble forecasts.  Approximately 100 forecasts from various model ensemble forecasts compose these forecasts, giving forecasters an idea of the range in possible outcomes.  Small boxes means generally higher confidence in the forecast due to a smaller range in values, while a wider range means less confidence.  So what are the models showing for forecast temperatures this week for Spokane?

***Updated Apr 24th*** GFS, ECMWF, and Canadian Models Box and Whisker Forecast for temperatures for Spokane, WA through May 2nd, 2023

The red boxes represent the high temperature forecast, with the boxes staying fairly small through Saturday, with high temperatures warming into the 70s.  By next Sunday and especially Monday the boxes increase in size, leading to more possible outcomes and thus less confidence. You may be wondering what the vertical gray lines mean.  These are the "whiskers" and represent the model solutions that are more extreme (both warm and cold) but are still important information for forecasters to consider.

But we have taken things even a step further.  All the temperature forecast above are straight from the models, and have not gone through any sort of calibration.  Why is this important?  It's possible a model can have a persistent bias towards being too warm or too cold, which is important to try and alleviate.  This is where the NWS relatively new set of forecasts come into play.  Below is the calibrated version from the NWS NBM (National Blend of Models).

***Updated Apr 24th*** National Blend of Models (NBM) Box and Whisker Forecast for temperatures for Spokane, WA through May 3rd, 2023

This pretty much says the same story, just with slightly different numbers and ranges.  Increased box size later in the weekend into early next week means there is increased uncertainty out that far into the forecast.

Some may be saying "This is too complex, just tell me what the temperatures are going to be!"  Well we can do that, but it's always good to have some background information into the forecast so you know how confident we are.  Here is our forecast as of Sunday morning for the upcoming week.


***Updated*** NWS Official Forecast Temperatures issued 3 AM PDT Monday, April 24th, 2023

The warmest temperatures of 2023 for many locations are forecast this week.  How long will it last?  This is unknown with a lot of model variability heading into next week.  For the latest forecast, head to https://www.weather.gov/spokane

Saturday, April 8, 2023

Heavy precipitation expected, but will we see flooding?

Warm and wet weather is coming to the Inland Northwest. But how wet is it going to be and will the resultant precipitation result in widespread flooding? This can be answered by looking at a few things, including precipitation amounts, snow melt, and antecedent conditions. We will start by discussing the precipitation. 

PRECIPITATION: The latest official forecast for Spokane is calling for 0.97" of rain over 48 hours starting 11 AM Sunday and lasting through 11 AM Tuesday. Spokane won't be the only area receiving significant rainfall, but much of the Inland Northwest will as well. This rainfall is coming from an unusually strong atmospheric river for this time of year. In fact, we could set a daily record for precipitable water values (total amount of moisture in the atmosphere) on Monday. 


Atmospheric River forecast

This event places just below the top 10 wettest (12th wettest) 48 hour stretches for Spokane (records back to 1881) in April. If 1.00" of precipitation were to occur this from Sunday morning through Tuesday morning in Spokane, the monthly total precipitation so far (1.33") would exceed the average April total (1.12") within the first 11 days. That would place the April 2023 total precipitation in the top 33% of all years by the 11th. It would also be the wettest 48 hour period the Spokane area has seen since May 20, 2020. 
Probabilistic data from our weather models are useful to predict the chance of 1.00" of rain over 48 hours in Spokane early this week. The current odds of exceeding this total in 48 hours is 16% so we are forecasting on the wetter end compared to the weather models. 12 hours ago, the weather models were indicating only an 8% chance so the newer runs of the weather models have doubled the odds of greater than 1 inch or rain.


Another way that we communicate forecast uncertainty is through using a range of possibilities such as a low end amount (90% chance that there will be more rain than what is forecasted) or a high end amount (10% chance of there will be more rain than what is forecasted). The first graphic below represents the low end amount for Spokane with this event. The second graphic represents the high end amount for Spokane. Given our official forecast is calling for 0.97 inches of rain, we are forecasting on the wetter side of the model possibilities. To follow the latest official forecast, please visit www.weather.gov/spokane.

Low End Amount (90% chance of exceeding 0.3" of rain)

High End Amount (10% chance of exceeding 1.13" of rain)

SNOWMELT: The other piece of the puzzle is what what will happen to the existing snowpack? Will we melt a considerable amount of it, adding to the precipitation runoff, or will it stick around for a while? Although this might sound like an easy question the answer, it is more nuanced than you might think. Even if the temperatures get well above freezing, that doesn't necessarily mean the snow will instantly melt and runoff into the rivers. First off we need to warm the snowpack temperatures to freezing. This animation below shows the snow pack temperatures over the past week. Red colors show the snowpack temperatures around freezing and primed for melting. Notice the rapid expansion of the red over the past week over the northern third of eastern Washington, especially in the valleys below 3000-3500'.   


This suggests the snow will melt off quickly in the northern valleys especially considering we are going to see temperatures well above freezing from tonight through Tuesday night. However, even the snow is going to melt, that doesn't necessarily translate to it running off since it can be soaked up by the existing snowpack. How can we determine if that's going to happen? To determine if the snowmelt is going to runoff we utilize something called snow density which is the ratio of the snow depth to the amount of water in the snowpack or snow water equivalent. For snowmelt to effectively runoff we want to see snow densities of  50% or greater. 

If you look closely at this map below most of the values are well below 50%. But the problem with this map is most if not all the values in the Inland Northwest are in the mountains above 3500' and don't tell us about the density of the lower elevation snow however we can be certain the snow ratios are higher than what's seen on this map. Consequently we'd expect to see a good amount of the low level snow melting off into the nearby rivers over northeast and north-central Washington and north Idaho.  But will that necessarily lead to flooding? 

Snow density values as of 4/8/2023


ANTECEDENT CONDITIONS: To help answer if we expect to see flooding, we can look at the antecedent conditions, or in other terms what's going on with the current river levels or soil moisture. Much of that can be determined by how much precipitation we've seen recently combined with how much snow melt we've seen. Over the past 3 months it has been exceedingly dry over the Inland Northwest, especially over north Idaho and extreme eastern Washington where some precipitation amounts are around half of normal. 

90 day percent of normal precipitation

Despite the dearth of precipitation, the much cooler than normal weather has resulted in a relatively normal snow water equivalent for this time of year. But it's a far cry from what most of the Western US has experienced this winter (widespread dark blue)

Snow Water Equivalent for 4/8/2023

So what do you get when you have lighter than normal precipitation and a relatively normal snowpack? This means there hasn't been a significant amount of runoff into the rivers. So how light has the runoff been this Spring? Extremely light is the answer! Check out this map below for the specifics. 

Steamflow vs normal for 4/8/2023

Notice all the red dots clustered over north Idaho into portions of northeast and north-central Washington. The dark red dots show locations that are much below normal for this time of year (10th percentile), and the bright red dots correspond to locations that are at their lowest level for the current date. These record and near record low spots include much of the Coeur d'Alene, St. Joe and Pend Oreille Basin in north Idaho and the Spokane (hidden by green dot over Hangman Creek), Okanogan, and Kettle River Basins in eastern Washington. 
For the Coeur d'Alene River, near Cataldo, it is at its lowest level for the date in the past 88 years! 

If we want to examine current ground water conditions, across the Columbia Basin there is a well sensor located just southwest of Davenport. Long term drought conditions have resulted in a steady drop in the water table since 2017. In fact at the beginning of the year the water table was roughly 50' below ground and the lowest this well has seen since 1992. 
Well Water Table southwest of Davenport, WA


THE FINAL VERDICT: So adding all this information up, what does this tell us? It tells us we have a lot of room in the rivers and groundwater to accommodate this upcoming rain and snow melt event.  So at this point we expect this to be a largely beneficial event rather than one with destructive flooding. That's not to say there won't be any minor ponding of water in low-lying areas, but we don't expect to see any major flooding at this time. Stay tuned for updates and monitor our latest forecasts for details. 

Wednesday, March 1, 2023

Inland Northwest, has The Winter of 2022-23 Been a Harsh One?

February has come to an end. Do you feel like this has been a bad winter?

Some may say, “Yes! This has been a long and harsh winter.” Others may have the opinion, “No. This winter seems pretty typical to me.” Let’s take a look at some data.
  1. Total snow accumulation
  2. How long snow has been on the ground
  3. Average temperature
  4. Extremely cold temperatures
  5. Winter’s duration

Our first data set

Total snow accumulation:
Has this winter been snowier than normal? Let’s look at a handful of snowfall graphs and compare them to the 30 year average (1991 - 2020).

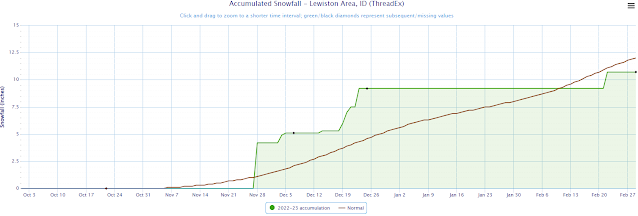
Accumulated Snowfall Graphs: 1) Spokane 2) Bonners Ferry 3) Lewiston 4) Wenatchee These graphs compare the snow that has fallen this winter (green trace) with the 30 year average (smooth brown curve).

SpokaneBonners Ferry ID
Lewiston ID
Wenatchee WA
graphs generated by xmACIS2

There are similarities between the first three graphs from Spokane, Bonners Ferry, and Lewiston. By February 28th, each trace is within a few inches of the seasonal average. The trace from Wenatchee is much different with nearly double the average snowfall through Feb 28th.

What about snow in the mountains? Snow sensors called SNOTEL (SNOpack TELemetry) collect data from remote high elevation locations across the Western U.S. and Canada. So this map will tell you more about mountain snow than the snow that has fallen in cities and valleys. The graphic below shows the Snow Water Equivalent (SWE) values for river basins across the Pacific Northwest as of March 1st. While many basins in Washington and north Idaho range from 85 to 100 percent of average, north central Washington stands out. Values in the mountains around Omak and Republic are as high as 130 percent of average.

Basin Snow Water Equivalent compared to normal.


Verdict based on total snow: Residents of north central Washington and Wenatchee are probably justified in calling this a harsh winter if we look at total accumulated snow for the season. For the rest of us that have had close to average snowfall, we may need to find another argument.

Our second data set

How long has snow been on the ground? Have you ever heard someone say something like this, “I remember that terrible winter! We had snow on the ground from Thanksgiving to the beginning of March!”

Finding data for how long snow has been on the ground is tough. There are only a handful of sites in the Inland Northwest that take daily snow depth measurements, and periods of missing data over the years makes it difficult to build a climatology of snow depth data. But, here’s a crude table from a few of our dedicated cooperative observers that provide the NWS with daily snow depth measurements.

Consecutive Days with Snow Depth of at Least 1 Inch

Site

First Day

Last Day

Total Days

Max Depth

Bonners Ferry ID

Nov 23

Jan 31

70 days

20” (Dec 21)

Moscow ID

Nov 28

Jan 3

37 days

14” (Dec 23)

Northport WA

Nov 23

Jan 19

58 days

16” (Dec 21)

Spokane NWS

Nov 7

Feb 7

93 days

16” (Dec 20)

Spokane Airport

Nov 7

Jan 15

71 days

15” (Dec 21)


With 93 consecutive days of at least 1 inch of snow on the ground, employees of the National Weather Service have seen a lot of white on the landscape this season. Folks around Bonners Ferry are used to seeing snow on the ground for weeks during the winter, but 70 days is a long time to deal with snow on the ground, too.

Verdict based on how long snow has been on the ground: Inconsistencies in the data make this a tough argument. There is also a lot of variability in the typical snowpack across the Inland Northwest depending on elevation and local snow climatology. However, many places in the Inland Northwest received snow in November. For those of us who held onto that snow well into February, you are probably justified in saying that you have seen snow on the ground for a long time this winter

Our third data set

Temperatures compared to average: For the Pacific Northwest winter-like temperatures arrived early. November was a particularly cold month. For the state of Washington, November ranked as the 6th coldest on record according to the National Centers for Environmental Prediction. Idaho experienced its 4th coldest November on record!

https://www.ncei.noaa.gov/


December remained cold especially in Washington, ranking 17th coldest on record. The state average temperature for Idaho didn’t rank as cold. Idaho had its 48th coldest December on record.


January trended toward milder temperatures. States in the Pacific Northwest were actually “Near Average” or slightly “Above Average”.


As of the creation of this blog, statewide average temperature ranks have not been calculated for February. However, data collected by the Western Region Climate Center indicate that February will end up with below average temperatures.


Verdict based on temperatures compared to average: Even though January was not particularly cold, November, December, and February were colder than average. And since November’s temperatures were so much below average, it seemed like the Pacific Northwest got an “extra December” this winter. Residents of the Pacific Northwest are justified in saying that this winter has been a long one. And the arrival of an Arctic blast late in February makes this winter seem even longer for many Washington and Idaho residents.


Our fourth data set

Extremely Cold Temperatures: Speaking of Arctic blasts, how many of them did the Inland Northwest experience this winter? There have been five identifiable Arctic fronts this winter. Beginning with our first Arctic front in early November and including our late February blast of cold temperatures, the Inland Northwest has experienced biting north winds and dramatic temperature drops about every 3 or 4 weeks this winter.


Our most noteworthy Arctic front of the season occurred between December 21st and 23rd. Widespread below zero readings were observed with some of the coldest locations dropping below -20F, including Porthill (-30F), Addy (-28F), Naples ID (-27F), Colville (-24F) and Bonners Ferry (-20F). Some of these readings were the coldest in decades. Northeast and north central Washington experienced lows of -20 to -30 degrees! Temperatures in our region hadn’t been that cold in a decade or two.


Morning temperatures December 22, 2022


Our most recent Arctic front broke or tied several records for February 23rd and 24th. Spokane’s low temperature of 3 degrees on the 24th tied the record set in 2011. Several stations including Spokane, Wenatchee, Ephrata, and Omak experienced record cold afternoon high temperatures on the afternoon of February 23rd when highs struggled to reach the mid teens and low 20s.


Verdict based on extreme temperatures: While there have been relatively few record cold temperatures this winter, residents of the Inland Northwest are justified in claiming that this winter has featured some of the coldest temperatures in many years. The December 21st to 23rd event was really cold for our region!

Our fifth data set

Winter’s Duration: We have already mentioned that winter “arrived early”. November was much colder than average, and many places across the Inland Northwest were snowier than average in November, too. Will winter also be late to loosen its grip on the region?

The latest outlook from the Climate Prediction Center for the month of March does not look favorable for an early arrival of spring. There is a 60 to 70 percent chance of colder than average temperatures for the month of March. Snow in March typically struggles to accumulate and frequently doesn’t last long. However, we may not be done with the threat of lowland snow. The combination of colder than average temperatures and the outlook leaning toward at or slightly above average precipitation suggests that we may still have some white stuff to look forward to.


Verdict based on winter’s duration: Even though there was a period of relatively mild weather in January and early February, residents of the Inland Northwest have a legitimate gripe about how long this winter has been. The likelihood of cooler than average conditions persisting into March gives the “this has been a bad winter” camp another leg to stand on.


Final Thoughts: Of course, our views on whether or not this has been a harsh winter will vary from person to person. There is also a lot of variability from place to place. The Inland Northwest climate is highly varied from the Methow Valley to Moses Lake to north Idaho. Where we grew up and our collective experience with winter weather also forms our opinions. And some people just like winter while others do not. We hope you enjoyed reflecting on the winter our region has experienced so far.

-------------------------------------------------------------------------------------------------------------------------

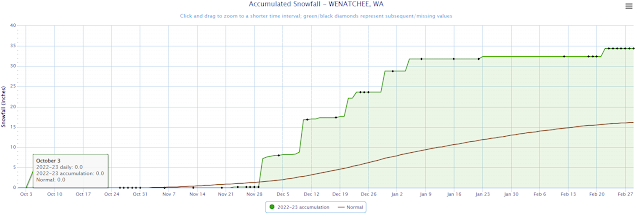
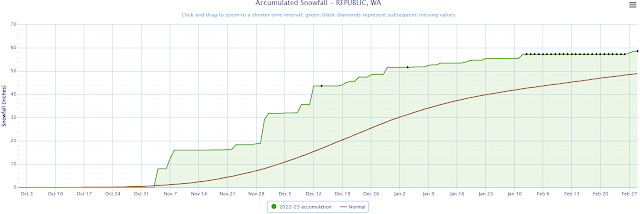
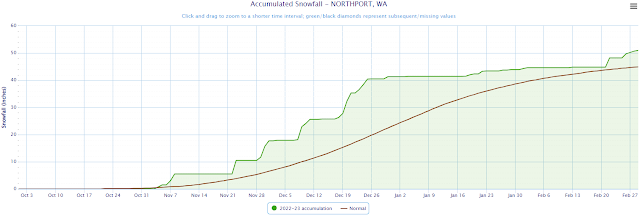
Additional seasonal accumulated snowfall graphs: Here are a few more accumulated snowfall graphics for various stations across central and eastern Washington as well as north Idaho. Hopefully you find one that is representative of where you live.