Thursday, February 13, 2020

Forecast Consistency (or lack thereof) for this weekend's winter storm

  You may have heard by now that a winter storm is coming to the Inland Northwest this weekend. While that is still true we are still trying to wrestle with what's been a particularly troubling forecast? Why is this forecast so difficult compared to others we do in the winter? The biggest reason has to do with forecast consistency or in this case a substantial lack thereof. When doing forecasts beyond a couple days we meteorologists are highly dependent on using weather models for guidance. We have a plethora of models to choose from and picking the best one isn't always an easy task. In fact in the winter this often isn't easy. But whats making this forecast especially tough is the models are offering us a multiple of solutions or forecast scenarios and the consistency from run to run has been unusually poor. When we see good consistency with the models this makes forecasting easier. Below is a great example of good forecast consistency. This map shows a ridge of high pressure forecast over the Upper Midwest for this afternoon. Each frame represents a subsequent model run from the GFS starting from last Sunday and ending with the model run from this morning. Notice that although the center of the high pressure (blue H) moves slowly westward with each model run, the overall pattern does not change much. Even the positioning of the light snow (blue shading) near the eastern Great Lakes does not show a huge amount of variability. So if a forecaster were sitting on the forecast desk for the past couple days and was following this evolution they could be fairly confident in forecasting a dry over most of the Upper Midwest.

GFS Forecast consistency over the Upper Midwest for this afternoon (2/13). Courtesy of Tropical Tidbits
OK so that forecast was an easy one for a ridge that isn't over our region. How about over the Inland Northwest what's the story? Let take a look at the cold front we expect to pass over the region this afternoon and evening. Although there are no definitive highs or lows on the chart below over the Pacific Northwest, there is a fairly consistent pattern with the precipitation. Notice over the Cascades, snow was depicted by the last 8 GFS model runs as well as rain off the coast and over the western interior. Meanwhile over eastern Washington into north Idaho there has generally been a consistent band of rain and snow extending from southeast Washington and into the Idaho Panhandle. This is the band associated with the cold front. For winter weather, this is very good consistency. Even the transition from rain to snow right around Spokane has been consistent.

GFS Forecast Consistency for the Pacific Northwest cold front as of 10 pm Thursday (2/13). Courtesy Tropical Tidbits

Now lets get to the system that started this whole discussion, the one for the upcoming weekend. When we posted our graphic yesterday here is what was shown. Notice each run was showing a low (red L) but look at how much variation there is from run to run. We know that the heaviest precipitation will be associated with atmospheric forcing or lifting from the low, but in order to put that information into our forecasts we need to have a good idea where the low is going to move.  Confidence levels when dealing with this type of model to model variability result in a very low confidence forecast. 

GFS Forecast Consistency for the Pacific Northwest storm system for 4am Sunday (2/16) Courtesy Tropical Tidbits
So far we have only looked at consistency using an operational model. This is not the best way to forecast for a weather scenario that is several days out. We have better tools at our disposal called ensemble forecasts. So what is an ensemble forecast? An ensemble forecast is a set or cluster of forecasts that present the range of weather possibilities in the future. To create the ensemble forecasts, multiple model simulations are run, each with a slight variation in its initial conditions. These variations begin to increase over time (in other words we will see more variations in the model forecast 144 hours out in the future compared to 12 hours out). These variations represent the uncertainty in the forecast and suggest a range of possible weather outcomes. If ensemble runs show little variation during portions of the forecast, this would infer a high probability of outcome and a high confidence forecast. If there are large variations, this would represent a low confidence forecast. For more on ensemble forecasting check out this link.

So what do the ensembles show for this weekends storm? First lets look at the position of the low pressure center as forecast by the GEFS or Global Ensemble Forecast System. The image below shows the positioning of the low forecast by each ensemble member of the model (there are 21 of them) as well as the average in all the solutions (black isobars). The red numbers correspond to the depth of the low and its center for each ensemble member (posted in millibars) while the colors in the background show the differences in all the runs. The brighter the colors the more variability in the runs. So on the image below the greatest variability is over the north Cascades (light green shading). This was the latest run of the GEFS.  It still does not give us a great amount of confidence as there are low centers scattered around much of area from the north Cascades to northwest Montana. The mean of all these runs places a broad (albeit weak) low across much of the Inland Northwest into northwest Montana.


GEFS Low pressure centers for 4 am Sunday. Courtesy of Tropical Tidbits
How did previous eight runs of the GEFS look? Although they all show some semblance of a low, the strength, positioning, and timing are all over the place. And the variability from run to run is substantial. Typically ensemble runs and their means tend to subdue the run-to-run variability. This isn't what we like to see when faced with the possibility of a large winter storm in our future.
GEFS Low pressure centers for the past 8 runs starting with the 10 pm Sunday run (2/9). Courtesy of Tropical Tidbits

So far we have only looked at weather maps which show the general positioning of the highs, lows,  precipitation, etc. But the devil is in the details. What does this translate into tangible weather on the ground? Since snow is generally the crux of this forecast and in the thoughts of many people, we can actually look at this element over Spokane again utilizing the power of ensemble forecasting. So what does this show? Below is the answer. Each grey line represents one of the 21 ensemble members. Some of the members show as much as 7 inches of snow in Spokane, while others barely have an inch. The blue line represents the GFS run while the black line is the mean of all the models. So as you can see the answer is all over the place. It all depends on the eventual track of the low. If it moves to our north (we think this is most likely based on other models), we would likely expect to see amounts on the lower end of these possibilities, while if it moves right over Spokane or slightly south we would see amounts on the higher end of the spectrum.
GEFS Plumes for snow over Spokane for this weekend.


While we don't have a lot of confidence for valley locations such as Spokane, we have much higher confidence it will snow (heavy at times) over the mountains as they are less dependent on the track of the low and more dependent on orographical lifting of moisture over the mountains due to upslope winds. Based on pattern recognition and the most likely low track our greatest threats will be near the Cascades, Central Idaho Panhandle Mountains, Blue Mountains and Camas Prairie. But that is subject to change as the models continue to offer a plethora of solutions. All we can say for now, is standby and wait for our latest updates for this daunting forecast.


Thursday, January 9, 2020

We can hear Winter knocking on our door


Thus far the winter of 2019-20 has been a fairly mild one, in fact since mid-November this has been the mildest winter since 2003 and previous to that the 1967!

Average temperatures 11/15-1/8 by year in Spokane


For those that like mild winters this has been a fantastic season, however that often doesn't equate to a good snow pack in the mountains and that has certainly been the case this season. Aside from the northern tip of the Idaho Panhandle, the snow pack this year has been lacking.
Snow Water Equivalent as of 1/9/20


But what has been the norm so far this winter is going to come to an abrupt end shortly due to a growing disturbance currently over the Gulf of Alaska. Below on this water vapor loop we can see the system rapidly approaching the Pacific Northwest. This system is the yellow swirl due south of Alaska.
Water Vapor imagery care of College of DuPage

As the system heads toward the coast it is expected to spin up a deep surface low initially right off the coast and then move it inland through the day. This will spread a swath of precipitation across the Inland Northwest beginning early in the morning near the Cascades and shifting toward the Washington/Idaho border several hours later. The precipitation is expected to be light at the beginning of the event, but then should become moderate to heavy at times in the afternoon as the low gains strength. The depiction below is from the 12z GFS model which is what we trended our forecast toward (as well as several other similar forecasts).

12z 1/9/20 GFS Run care of Tropical Tidbits
 What is somewhat troubling about the forecast (and the image above) is look how close the rain/snow line (boundary between the green and blue shading) is to Spokane by late afternoon. If the low heads a little farther north than shown here it's conceivable we could see some of the forecast snow turning to rain. This issue is less problematic well north of the Highway 2 corridor in Washington where we are more certain of seeing primarily snow. So how much snow are we forecasting at this time for the Inland Northwest?

Most Likely Snow Forecast

But if the low moves farther north than expected we might see snow amounts more like this. This is what we call our "Expect at least this much" snowfall forecast. We expect a 90% chance of seeing at least this much snow.

Expect at least this much Snow Forecast
So even if the latter forecast pans out, we still would expect to see some significant impacts to travel across the northern third of Washington, in the Cascades, and over the Idaho Panhandle.


But this is just storm #1, we are now expecting another to come in rapidly on it heels. Once again lets refer to the 12z GFS model from this morning (1/9/20). Once again the low is forecast to take a similar track across the Northwest. But what's different about this one is there will be a much lesser chance of warm air being dragged northward into the low. And thus whatever falls will likely fall as snow. Also this low will be a little deeper (and stronger) and thus there will be a greater potential for more intense snowfall rates and stronger winds.
12z GFS 1/9/20 Surface low track from Sunday morning-Monday Morning
So how much snow are we expecting for this second storm? Here is our latest forecast, but this is subject to change.
Sunday-Sunday night Snow forecast

So between the two systems that's quite a bit of snow. But that's not the entire story because this snow will likely be followed by a surge of much colder weather.


Then comes the Cold!


This cold will come care of a building ridge over western Alaska (denoted by red/magenta shading) which will result in the deepening of the trough and resultant northerly flow over western Canada and the Pacific Northwest. The heights will be much lower (and colder) than normal through the period as denoted by the dark blue shading.

500 mb heights from the GFS for late Sunday through Wednesday

So this above is the upper air pattern (at 18k feet above the ground) but what about closer to the ground? For that let's look at the 850 mb maps (around 3-4k feet above ground). And this is showing we have some very chilly temperatures in our future. Pay attention to the loop below and note the surge of cold blue temperatures heading our way from Monday and beyond. These will undoubtedly be the chilliest readings so far this winter, but they could also be some of the coldest temperatures we have seen in years! Pay specific attention to the blue dotted line on the chart which denotes the -20°C or colder line. From Tuesday into Wednesday the model shown below has that line south of Spokane, which is noteworthy for bringing some of our historically cold temperatures.

850 mb temperature forecast from the 12z 1/9/20 GFS


Other models are aren't quite as cold, but they all share a similar message. So how cold are we talking? Right now here is our forecast for high temperatures on Wednesday:
Wednesday High Temperature Forecast
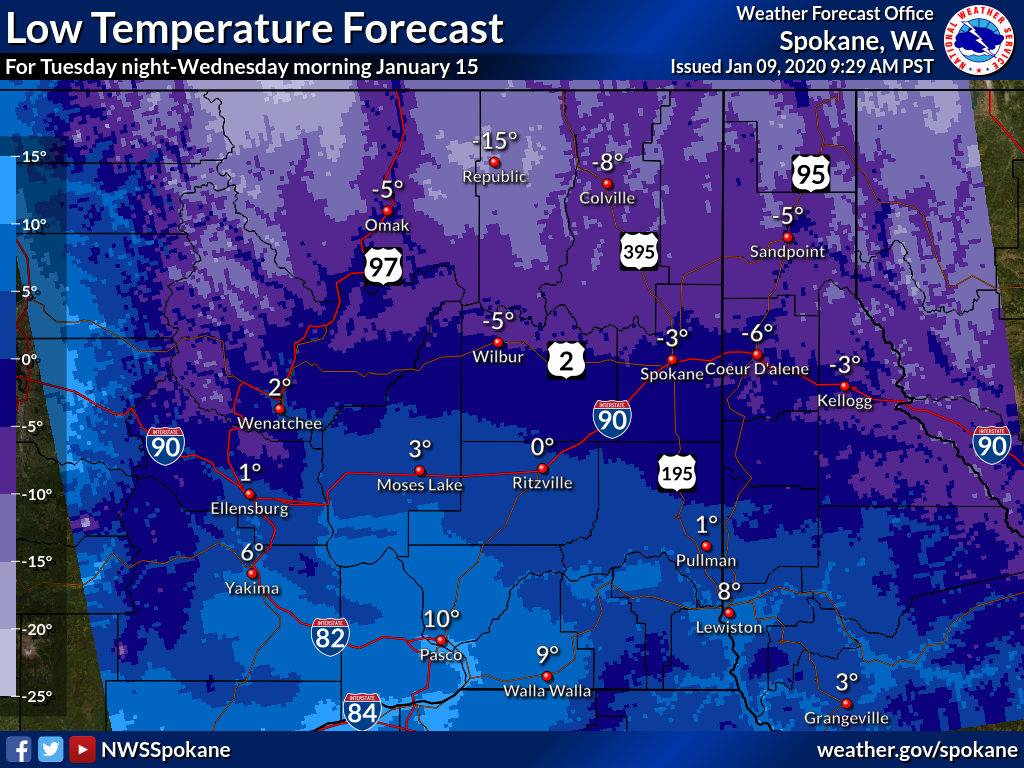
The last time we saw a high temperature this cold was on February 5th 2014 when the high was only 11°F. On that day the 850 mb temperature at our office was right around -20°C.  So we are likely looking at temperatures at least that chilly during the day. For lows we are forecasting even chillier temperatures with widespread sub-zero readings expected, including -3°F in Spokane and -15°F in Republic.The Spokane area has not seen temperatures this cold since 2017.
Wednesday morning Low Temperature Forecast


But it could be even colder than is forecast here based on this input from the GEFS Ensembles. The raw GFS temperatures are denoted by the blue line on the chart below, while the mean from the GEFS (solid black line) is at least several degrees colder from Monday-Wednesday. What is more troubling is there are quite a few of the grey lines (each denotes a model member) which show significantly colder temperatures than forecast (yes some are warmer as well). Some of the members for Wednesday morning are showing readings of -20°F or colder. But most importantly there is a large spread between all these lines in the Monday-Wednesday period which suggests there is quite a bit of uncertainty with the forecast, unlike the first few days of the forecast where the lines are tightly packed together. So while we are certain, it is going to get colder, we just aren't sure how cold it will get. There is decent certainty that conditions will begin to moderate (slowly) after Wednesday but conditions will certainly remain below freezing.


But there will also be some winds before the cold arrives!
Typical of an intrusion of cold air from the north, we usually see a period of brisk north-northeast winds and this system should prove no exception. We are thinking the winds will arrive after the Sunday system exits the region or Sunday night into Monday. Again here is the 12z 1/9 run of the GFS. Notice the blue and green colors that develop after the low dives to our south. These denote sustained wind speeds of 15 to 25 mph with gusts from 30-40 mph possible down the Okanogan Valley and Purcell Trench from (Sandpoint to Coeur d'Alene).
Wind forecast from the 1/9 12z GFS
 Combining the winds and cooling temperatures results in some very cold wind chill values. 


Wind Chill Forecast (Min values) for Sunday night-Monday
 So in summary...if you've enjoyed the mild winter we've seen across the Inland Northwest thus far, you won't like our upcoming forecast. If you are yearning to break out your snow blower you will most likely be in luck with plenty of snow forecast for a large portion of the Inland Northwest. The snow will be followed by dangerous cold so remember to protect your pets, pipes, and dress warmly. This weather change may feel more dramatic than usual since it has been so mild this winter.