Friday, November 20, 2020

Thanksgiving Pattern Change

For the past few days several of the long range forecast models have been advertising a pattern change starting around Thanksgiving, and persisting through at least early December.  What does this mean?  We will get to that in a little bit.

Outlook through Thanksgiving Eve

First, let's discuss the weather leading up to Thanksgiving.  This graphic sums it up


After a dry weekend, the potential exists for light snow Monday morning in some areas which could make for a slick morning commute.  Then Tuesday into Wednesday another system moves in for more unsettled weather especially over the mountain passes.  If you do have pre-Thanksgiving travel plans keep this in mind.  Here is what the weather pattern looks like for Tuesday and Wednesday - as this will provide a nice comparison for what may lie ahead after that.

12z Nov 20th GEFS Model forecast of 500mb heights and anomaly valid 4 AM PST Nov 25th, 2020

Note the cooler (blue) colors over our region as a weather system is passing through.

Thanksgiving onward

Starting on Thanksgiving and going through the rest of November, we notice a change in the weather pattern according to this latest model ensemble forecast from the US GEFS Model.

12z Nov 20th GEFS Model forecast of 5 day averaged 500mb heights and anomaly valid Nov 26-Dec 1st, 2020

What we can see is a zonal (west to east) flow pattern taking over the Pacific, with a milder west to southwest flow for our region.  The pattern energizes further going into early December based on this ensemble model output.

12z Nov 20th GEFS Model forecast of 5 day averaged 500mb heights and anomaly valid Dec 1st-6th, 2020

But this is just one model ensemble system (US GEFS).  Since we are 12-16 days out into the future, we need to examine other ensemble systems to gage confidence in this solution.  

Here is the Canadian version valid Nov 30th-Dec 5th

12z Nov 20th GEPS Model forecast of 5 day averaged 500mb heights and anomaly valid Nov 30-Dec 5th, 2020

Pretty close agreement which increases our confidence.  Mild southwest flow very prevalent from this solution.  Another ensemble system, European (not shown), agrees with this idea.   Thus confidence is a little higher than typical for a 1-2 week prediction for this pattern to set up.

Here is a closer look at a typical jet stream setup with this pattern, with this specific model solution valid Dec 3rd.

12z Nov 20th GEFS Model forecast of 500 mb heights and winds valid 4 am PST Dec 3rd, 2020

This shows the jet stream north of our area, which is a mild pattern.  This is especially true over Central Canada with the influx of mild Pacific air.  Below is the US GEFS predition of temperature anomalies at 850 mb (~4500 feet MSL).

12z Nov 20th GEFS Model forecast of 850mb temperature anomalies valid Dec 1-6th, 2020

Note no large cold anomalies anywhere close to our region.  Note this pattern can bring inversions which could hold down temperatures in some areas of the Inland NW.  And here is the Canadian version, really going for the mild temps Nov 30th-Dec 5.

12z Nov 20th GEPS Model forecast of 850mb temperature anomalies valid Nov 30th-Dec 5th, 2020

What do the CPC outlooks suggest?  Here is the outlook issued November 20th valid Nov 28-Dec 4th.

Climate Prediction Center 8-14 day temperature (left) and precipitation (right) outlook issued Nov 20th valid Nov 28th-Dec 4th, 2020

Elevated odds of warmer than normal temperatures, with about normal precipitation.

You may be asking, what is up with these milder temperatures, aren't we in a La Nina Winter?  Why yes we are, but it is not uncommon to have atmospheric patterns change since La Nina is only one factor that influences our weather.  So don't expect this pattern to last forever.  


Thursday, November 12, 2020

Complex Storm - More heavy wet snow for some

For those monitoring your local weather forecast, you may have noticed some big changes in the past 24 hours depending on your location. Some model solutions a couple days ago were showing potentially strong winds on Saturday. How those details have changed! Now the storm is evolving into a snow maker, and coming in faster with snow starting this evening in North Central Washington, and then late evening and overnight across NE Washington into the Idaho Panhandle.  This has prompted the issuance of several Winter Storm Warnings and Winter Weather Advisories!

Timing

The tricky part of this forecast is snow accumulations as temperatures in many areas will be hovering near the freezing mark. Will get more into this in a little bit, so let's talk timing of rain and snow. 

12z Nov 12th NAM 3 km model run of precipitation type/intensity

The above animation reflects one model run, so actually timing and precipitation type may vary.  As you can see, most areas across northern Washington into the Idaho Panhandle will see snow, as well as the palouse.  Also note the snow for the morning commute for much of NE Washington and North Idaho.  Allow extra time for your morning commute.

The I-90 corridor from Moses Lake to Ritzville and areas south and east towards the Lewiston-Clarkston Valley should see mainly rain.

Snow Amounts

What about snow amounts?  Models have trended towards increasing snow amounts.  For example, here is a loop of the past three model morning runs from the UW WRF GFS.

UW WRF-GFS 24 hour snow accumulation forecast ending 4 PM PST Friday from three model runs since Tuesday, Nov 10th.

At the top right of the image you will see the date the model was run (after Init:), with the latest run (Nov 12th being the last image).  Legend of amounts is at the bottom.  You can see the latest image has really increased the snow amounts across portions of Eastern Washington and north Idaho with 6+ inches in many areas even some localized amounts near a foot! But can we believe it?

Well, another model we look at, the European model, is hitting NE Washington and N Idaho with anomalous snow as noted by the light blue shading which would support the heavy snow threat.


Another way of looking at potential accumulations is through model ensemble forecasts.  This is a model run multiple times just with slightly different initial conditions to give us a better idea of uncertainty in the forecast.  As you'll see below Spokane carries high uncertainty with a large spread in snow amounts while Pullman carries greater confidence 2-3".

15z Nov 12th SREF Model forecast of snowfall for Spokane Airport and Pullman through 4 PM PST Friday


Why is this the case?  Temperatures will be near the freezing mark Friday morning but should be moderating above freezing by mid to late morning.  But the longer temperatures stay near freezing, the higher the amounts will be.

Here is our snow forecast as of Thursday afternoon:


NWS Snowfall forecast issued 230 PM PST November 12th, 2020 valid 4 PM Nov 12- 4 PM Nov 13


Reminder, the NWS will continue to evaluate the snow forecast and these values may change.  For the latest forecast for your area, go to our web page weather.gov/spokane for the latest forecasts.

Here is some additional snowfall probabilistic guidance we receive at the NWS based on multiple model/ensemble forecasts.  Here is what they are showing for chances of exceeding these thresholds:

2" or more


4" or more


8" or more


The snow we get will endure some melting in the afternoon, with high temperatures warming into the upper 30s to low 40s in many valleys.


In summary, get ready for more snow.  Most areas across northern Washington into the Idaho Panhandle will see snow, as well as the palouse.  Also note the snow for the morning commute for much of NE Washington and North Idaho.  Allow extra time for your morning commute.

Monday, November 2, 2020

La Nina - Does this mean a harsh 2020-21 winter?

After high winds and even snow already hitting parts of the region in October, many may be wondering what this winter will bring.  In this blog we dive into the Winter 2020-21 outlook, so lets get to it.

Some of you may have already heard about the upcoming La Nina winter.  What does this mean for the Inland NW?  Let’s take a look at the general pattern that often sets up during a La Nina.


Typical La Nina pattern


Typically the jet stream enters into the region from the northwest bringing in cooler temperatures and precipitation.  This is a good combination for snow lovers, with just about all locations historically receiving above normal snowfall.  But not every La Nina brings above normal snow! Here is a locally developed map showing percent of normal snowfall for all La Nina years from 1950-2015 based on historical snow data for all our COOP sites as well as airports.


% of normal snow La Nina years 1950-2015


This map is interactive, link here. Snow charts are available like the one below for all sites on the map by either clicking on the number icon on the map, or by selecting a city to the right of the map.


Spokane snowfall (inches) based on ENSO.  Red line is average snow for all years 1950-2015 


It is worth noting however that every La Nina is different, as shown by snow totals for all La Nina winters in Spokane since 1950


Spokane snowfall for each La Nina year since 1950


The reason for the difference is another oscillations in the atmosphere that impact our weather during a winter.  La Nina is only one piece of the puzzle.


So what will this La Nina bring?  Let’s take a look at the Sea Surface temperature anomalies in the Central and Eastern Equatorial Pacific from Oct 4-31st, 2020.


Wow, that is a lot of blue in the equatorial Pacific!  A large area of cooler than normal waters which continues to cool with time.  Anything colder than -1.5C that persists for a duration of three months or more in the central and eastern Equatorial Pacific (Nino 3.4 region) would be classified as a strong La Nina. 


This particular model has a good handle on the current anomalies, suggesting a strong La Nina this winter with the cold anomalies bottoming out near -2.0C.  Each line in the image is one ensemble member forecast amongst the same model.

CFS Model of Nino 3.4 SST anomalies

Past strong La Nina years


We thought it would be interesting to look back and previous Strong La Nina episodes to see what happened.  Here we will look at 3 of the past 4 events.

2010-11


The last strong La Nina year was 2010-11.  This was a harsh winter in terms of several cold air outbreaks.  Republic had four episodes where lows dropped below 0F, with the coldest low -14F. The blue bars on this graph are the observed temperatures for each day.


Republic temperatures Oct 2010-Mar 2011

Similar story for Pullman, with temps as low as -12F that winter


Pullman temperatures Oct 2010-Mar 2011

2007-08


Lots and lots of snow this winter.  Spokane had 92.6” for the season with January and February bringing frequent rounds of it along with drifting snow like this image from NWS Spokane on Feb 7th, 2008.


NWS Spokane February 7th, 2008

And Sandpoint an impressive 122.8”!


Sandpoint accumulated snowfall Oct 2007-Apr 2008


1998-99


This La Nina winter broke records in terms of mountain snow.  A very active jet stream brought frequent rounds of heavy mountain snow.  The map below shows horizontal wind speed anomalies for the winter with the enhanced jet stream aimed at the region


Observed zonal wind anomaly Nov 1, 1998 - Feb 28, 1999


Mount Baker in the Northern Cascades of Washington measured 1,140”, claiming this to be a world record!


Mt Baker snow totals with the 1998-99 noted as a world record

But the strong influx of milder air off the Pacific didn’t mean a snowy winter for many of the lower elevations.   Here is a temperature graph from Moses Lake (brown shade is the normal range while the blue bars are observed).  You can see temperatures were above normal for much of the winter, except for one cold spell just before Christmas.


Moses Lake temperatures Oct 1, 1998 - Feb 28, 1999

2020-21?


So what about this winter?  Lots of possibilities based on some of the recent strong La Nina years.  Here are the latest CPC outlooks.


CPC Dec 2020 - Feb 2021 Temperature Outlook issued Oct 15th, 2020

CPC Dec 2020 - Feb 2021 Precipitation Outlook issued Oct 15th, 2020

These outlooks suggests slightly elevated odds of cooler and wetter than normal conditions.


What are the climate models suggesting?  An active Pacific jet with above normal precipitation as noted by the green shading on the second image, and about normal or slightly above normal temperatures.


NMME forecast of temperature anomaly Dec 2020 - Feb 2021

NMME forecast of precipitation anomaly Dec 2020 - Feb 2021

It is worth noting though that the climate models can often capture the details of La Nina well, but often miss other less predictable factors that vary on the time scale of weeks. 


So what flavor of winter will this La Nina bring? La Nina winters historically bring above normal snowfall, so be prepared for an active winter.


Thursday, September 3, 2020

Labor Day Weekend - Heat, wind, elevated fire concerns, and potential dust

Have plans for the Labor Day Weekend?  We have heat, potentially critical fire weather concerns as well as blowing dust to discuss.

First let's talk about the dry conditions.  The Inland NW has been very dry since July 1st as noted by this graphic.

% of normal precipitation July-August 2020

Central Washington has been bone dry.  The NE Washington Mountains and the Idaho Panhandle has received only about half of normal precipitation.  That said, the fire danger class rating from Sept 2nd indicated high to very high very danger across much of the western US including Central and Eastern Washington and north Idaho.


Thankfully, despite the high fire danger, most of the current large fires are south of our region with air quality not looking too bad.   The exception is the Evans Canyon Fire near Naches, WA which has been producing a continuous feed of smoke the past few days and occasionally impacting air quality in some areas.  Part of the reason for the lack of fires in Washington so far is below normal lightning where NWCC (Northwest Interagency Coordination Center) has reported only 30% of normal lightning strikes for Washington and Oregon combined from June through August. 

Air Quality readings at 12 PM PDT Sept 3rd, 2020

For the current version of this map, click here

So what about the Labor Day Weekend?  Strong high pressure over the western US (as shown below) will deliver temperatures well above normal, with Friday likely one of the hottest days.

GEFS 500mb heights and anomlies valid 11 AM PDT Friday, Sept 4th, 2020

In fact, records may be in jeopardy at some locations.  Here is a look at our forecast for Friday compared to records for the day.


Now, look at the change by the end of the Labor Day Weekend.  Dust and fire concerns will increase significantly.  Saturday and Sunday locally breezy winds will occur near the Cascades.  On Monday strong high pressure shifts west off the coast, allowing a cold front to drop in from the north.

GEFS 500mb heights and anomlies valid 11 AM PDT Monday, Sept 7th, 2020


The combination of increased winds and dry conditions will further increase fire danger.  A summary of fire concerns is listed below along with burn ban information


Here is a clickable version of the burn restriction links from above graphic


Here is one model depiction for Monday showing windy conditions over much of the region out of the north to northeast.  The numbers depict free air wind speeds near 5000 feet MSL and a general representation of wind gust potential.  This pattern typical favors the Okanogan Valley, Columbia Basin, and the North Idaho Panhandle from Sandpoint down to Coeur d'Alene with the windiest conditions.

GFS 850mb winds and heights valid 11 AM PDT Monday, Sept 7th, 2020

These winds combined with low relative humidity will elevate concerns for rapid fire spread with any new fire starts.  The winds may also bring choppy water on area lakes.

Blowing dust is also a concern due to several freshly plowed fields across the Columbia Basin and Waterville Plateau.  Soil moisture is very dry over the region especially Central WA and across the Columbia Basin with little to rain over the past 60 days

Total precipitation July 5th-Sept 2nd, 2020.  Blue numbers on map are observed values from area weather stations.


To summarize, heat will initially be the main concern with record highs possible Friday in some areas.  Focus then shifts towards blowing dust, increased fire danger, and rough lakes by Labor Day.  


Have a fun and safe Labor Day weekend!


Sunday, April 12, 2020

I-90 Dust and Dry Spring

Dry and windy conditions on Saturday led to blowing dust on I-90 between Moses Lake and Ritzville, which contributed to a seven car pile up accident at MP200.  East bound lanes were closed, along with 1 west bound lane for about an hour.  Here is a picture courtesy of WSDOT.

Blowing dust on Interstate 90 - Photo courtesy of WSDOT
 

The worst of the dust on I-90 was seen on satellite imagery from 2 to 4 pm.  We tweeted a satellite loop showing the dust tracking across I-90 from north to south east of Moses Lake.  To see the loop, please click here


NWS Spokane Twitter post at 4:04 PM April 11th, 2020
New GOES-17 Satellite imagery also picked up on the dust, as shown by the darker pink colors near Moses Lake.

GOES-17 Dust RGB 2 PM - 5 PM PDT April 11th, 2020

And a more zoomed in look


So, what were the winds doing during this time frame?  A WSDOT sensor from Warden is shown below.  Winds were sustained around 25 to 30 MPH with gusts up to 42 MPH.

Warden observations

Here is a broader view of peak wind gusts from April 11th

Peak wind gusts from April 11th


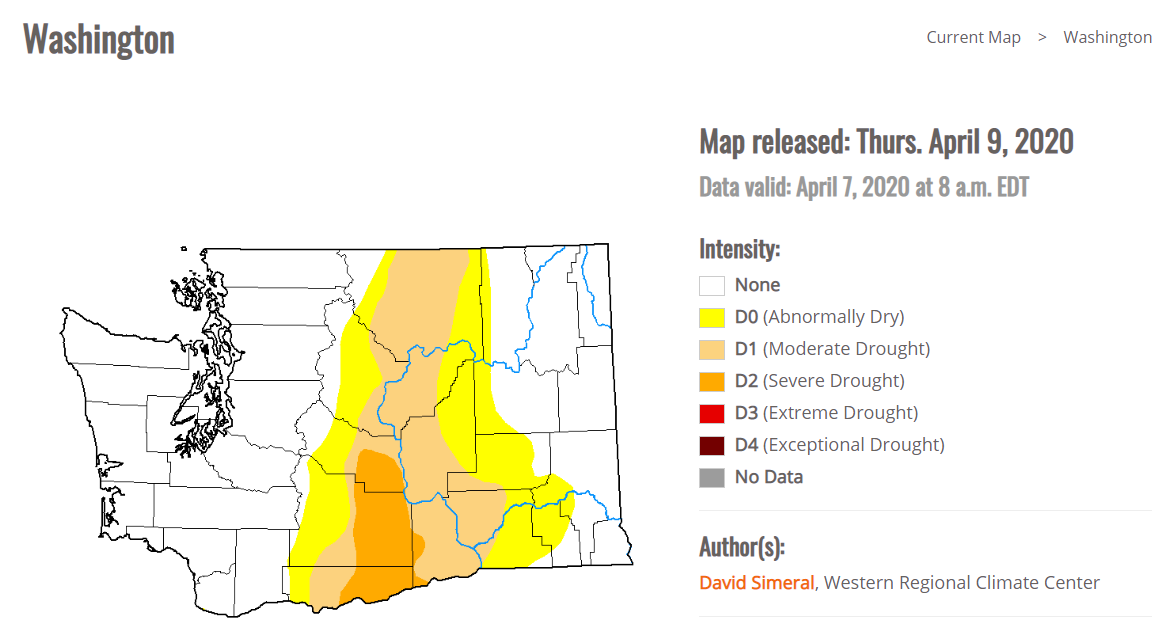
So what other factors led to the dust besides the dry and windy conditions?  For one, spring planting is ongoing with some freshly plowed fields.  Second, it has been very dry since the start of the water year across Central WA with many places only receiving about half of normal precipitation.  Even less for the Yakima Valley.


Moderate to locally severe drought is depicted in the latest US Drought Monitor

US Drought Monitor released April 9th, 2020

And while Central WA has been noticeably dry, it's worth noting that all of the region has been much drier than normal over the past 60 days.


What has caused this dry weather?  A large and persistent upper ridge in the Eastern Pacific.


The pattern this week looks similar, with a strong ridge off the coast providing more dry weather to most of the Inland NW. 

We will have to keep an eye out for more blowing dust potential across the Columbia Basin with any strong winds that develop given the dry soils and current Soil Moisture Ranking Percentiles.

Fortunately, at least for this week no strong winds are expected although breezy conditions are possible Tuesday night into Wednesday, but not as strong as what occurred on April 11th.  Also with the dry weather fire danger is above normal for the time being so pay extra attention to any burn restrictions for your area.