Thursday, September 26, 2019

Rare September storm

With lots of media coverage about the upcoming storm, we will take a look at this rare September event.  Only a few cases since 1900 have set up like this one so early in the season.  This pattern during the winter months is common, but late September is not.  The region will see early season snow in many areas, strong winds, and eventually freezing temperatures.   For the latest NWS forecasts including watches, warnings, and advisories please visit our web page found here

The setup

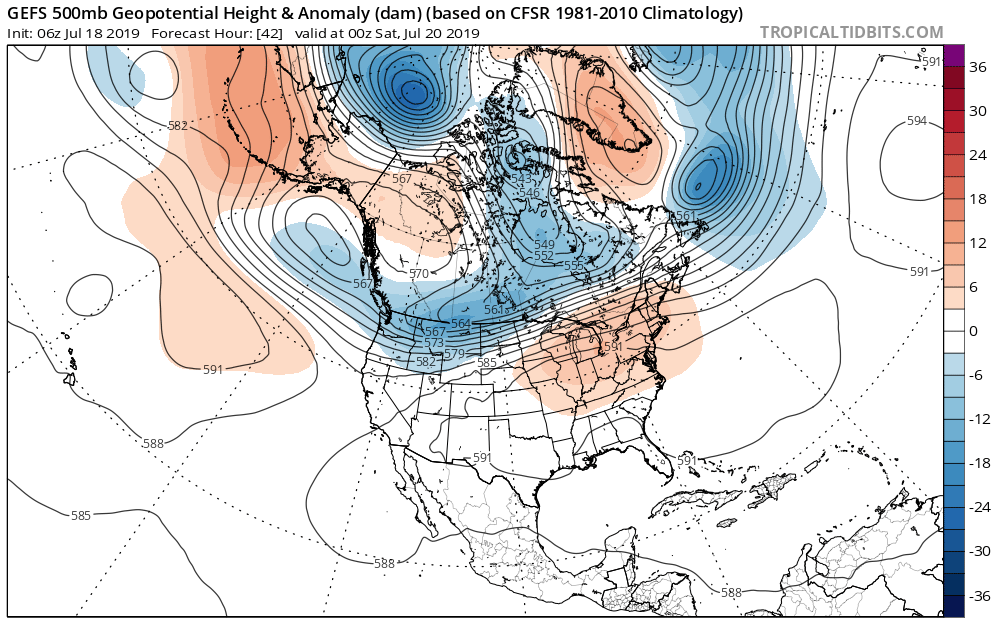
So why is this happening?  An amplified ridge of high pressure in the Eastern Pacific and a deep cold low over our region according to this model prediction.

12z/Sept 26th GFS forecast of 500mb heights and 250mb winds valid 11 AM PDT Saturday Sep 28th, 2019

The image is the jet stream diving south off the coast into California.

And this low is not in a hurry to move.  Here is a closer look at the storm for Saturday morning.  The image is relative humidity with bright green indicating higher moisture content and thus better chances for precipitation. 


12z/Sept 26th GFS forecast of 500mb heights and 850-500mb relative humidity valid 8 AM PDT Saturday Sep 28th, 2019

And now Sunday morning

12z/Sept 26th GFS forecast of 500mb heights and 850-500mb relative humidity valid 11 AM PDT Sunday Sep 29th, 2019

This low doesn't move much, with bands of precipitation continuing.  Also during this time frame we will have cold continental air pouring into the region.  Winds blow from high pressure to low pressure.  The tighter the lines are together, the stronger the wind.  Note the tight packing over the North Idaho Panhandle especially.

12z/Sept 26th GFS forecast of MSLP valid 8 AM PDT Saturday Sep 28th, 2019

Early season snow

Snow this early in the season is uncommon.  Below is a chart showing snowfall records for the month of September, and the number of days of measurable snow recorded during the entire period of record for the month.  Getting measurable snow in September has either never happened, or only once in the entire climate record for all towns across the area except Priest River with two occurrences.


So where will it snow?  A near certainty in the mountains.  Valleys will depend on elevation.  Here is our forecast issued Thursday afternoon regarding possible snow accumulations through the weekend.


The mountains will see 6+ inches for many locations.  The valleys have the potential for light snow amounts Saturday night into early Sunday on grassy surfaces mainly above 2000-2500 feet and across the North Idaho Panhandle.

Keep in mind ground temperatures are warm this time of year.  This will reduce the threat of snow accumulations on roads during the day with the overnight and early morning hours the most likely period of winter driving conditions in the mountains.  But any heavy bands of snow that set up could result in slushy conditions during the day as well. 

Snow levels will be falling this weekend.  Here are the forecast snow levels Saturday morning.


And now Sunday morning


Does this mean snow in your town?  Knowing your elevation can help when we are talking snow levels.  The tables below show elevations for selected towns and several high elevation highways and passes.


Strong winds

Saturday will have the strongest winds.  Here is the peak wind gusts forecast for Saturday


The strongest winds are expected from Sandpoint to Coeur d'Alene and across parts of the Upper Columbia Basin.  Winds of this magnitude may result in localized downed trees and power outages. These winds this time of year would typically pick up blowing dust across the Columbia Basin but expected precipitation should minimize this threat. The winds will persist Sunday but not as strong.  The winds will make it feel even colder as noted in next section.

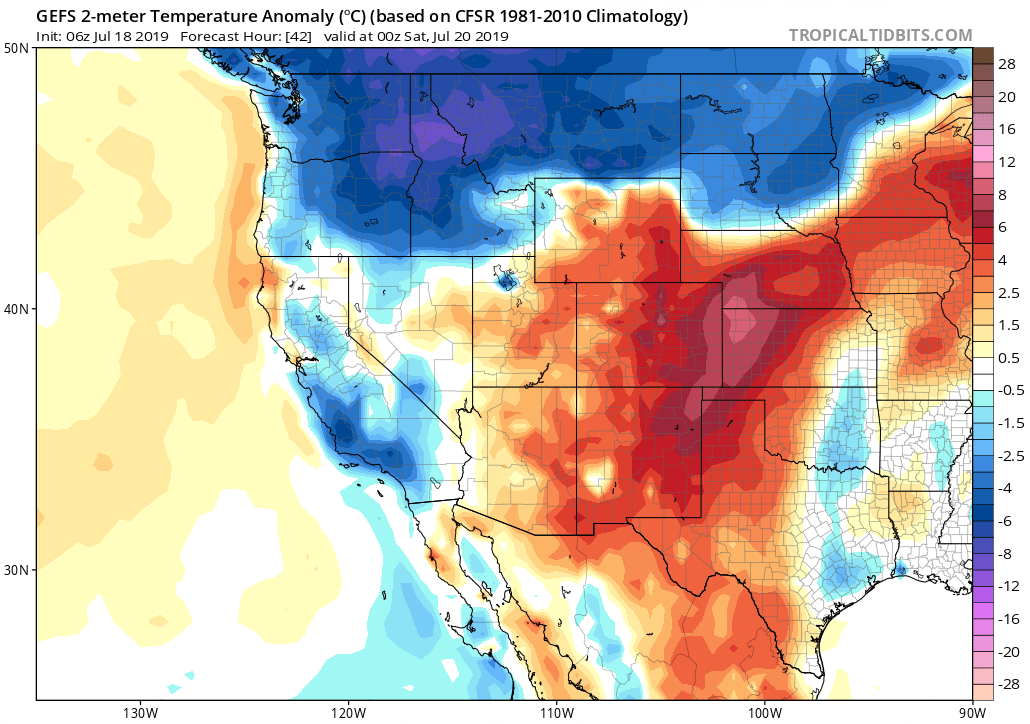
Unseasonably cold temperatures

Freezing temperatures will soon be hitting many areas beginning Sunday morning.  Here are the forecast lows for Sunday morning


 But the wind will make it feel colder.  Here are the forecast wind chill values for Sunday morning

Sunday morning wind chill forecast
For those heading out Monday for work or school, here are the forecast low temperatures.

 
Tuesday could be even colder for several towns.


Those with morning plans bundle up!  Freezing temperatures are expected for most while a hard freeze is possible in the colder spots. 

The high temperatures this weekend are noteworthy as well.  Daily records will likely be achieved in many areas beginning Saturday.  Monthly records are also within reach.  Here are the coldest September high temperatures ever recorded.


 Temperatures are expected to moderate towards the middle of next week, but still well below normal with the latest CPC outlooks favoring below normal temperatures and slightly elevated odds of wetter than normal in the Oct 2-6th time frame.


CPC 6-10 day temperature (left) and precipitation (right) outlooks issued Sept 26th, 2019

 This weekend will be a noteworthy September storm.  Get ready for winter like conditions. And if you have travel plans east into Montana, conditions will be even worse, much worse!

NWS Forecast of snowfall issued Thursday afternoon valid Friday night through Monday
For the latest NWS Forecasts for our local area or if you are heading east, go here:

NWS Spokane: link
NWS Missoula: link
NWS Great Falls: link
NWS Billings: link
NWS Glasgow: link

Friday, September 20, 2019

Turning much cooler - mountain snow?

There is growing confidence that the Inland NW will see much cooler temperatures to finish off the month of September.  Mountain snow may begin to fall, and the first freeze of the season will likely occur for portions of the Inland NW.

A strong cold front on Tuesday (Sep 24) will likely deliver windy conditions to the Columbia Basin, Spokane area, and Palouse which will be followed by much colder temperatures with highs in the 50s by next weekend. 

Here is the latest outlooks issued today (Friday) valid Sept 26-30th.

CPC 6-10 day temperature outlook issued Sept 20 valid Sept 26-30


CPC 6-10 day precipitation outlook issued Sept 20 valid Sept 26-30

Note the very high odds of colder than normal temperatures, with elevated odds of wetter than normal as well. 

Here is what one model is showing regarding the weather pattern.

12z GEFS forecast of 500mb heights and wind valid 5 PM PDT Saturday, September 28th

A large ridge in the Eastern Pacific and a deep trough over the Pacific Northwest.


Prior episodes such as this one (analog cases)
Based on the forecast pattern, the following graphics show the odds of below normal temperatures based on previous patterns that set up such as this one.  Here is the odds of below normal temps days 6-8 (Sept 25-27) based on previous events.

And now for days 9-11 (Sept 28-30)

And regarding mountain snow potential, let's begin with snow levels.  Here are the forecast snow levels published Friday afternoon for the morning hours of Thursday, Sept 26th.

NWS forecast snow level published Sept 20th valid the morning of Sept 26th
This is low enough to possible bring snow to the highest mountain passes (SR 20 over Sherman Pass and Washington Pass).  How about Friday morning

NWS forecast snow level published Sept 20th valid the morning of Sept 27th
Even lower, down as low as 4500-5000 feet.  There is currently low confidence regarding mountain snow accumulations.  This is still a long ways out so the details will likely change to stay tuned!  Anyone with late season outdoor hiking plans up in the mountains should be prepared for winter weather.

Much colder night time temperatures

Also of note is going to be a huge change in low temperatures.  Much of the region has experienced mild nights over the past 30 days thanks to cloud cover, and above normal moisture content in the atmosphere as the map below shows.

Departure from normal min temperature map valid Aug 20-Sep 18, 2019

Typically by late September, lows are in the upper 30s and 40s for most towns.  And even freezing temperatures have occurred in the colder spots.  Below is a table showing the average first freeze date for selected towns.


With the much colder weather, places that typically have had a freeze by now (Deer Park, Republic, Colville, Winthrop) have a very good chance of seeing their first freeze.  For places further down the list including Omak, Pullman, Kellogg, Ritzville, and Spokane it's too soon to have much confidence about freezing temps.  Lewiston and Wenatchee likely will have a tough time freezing this early.


Wednesday, August 21, 2019

Strong cold front passage today

A strong cold front will pass through today (Wednesday) bringing a burst of wind and rain.  How strong will the winds be and how much rain you ask?  And when will they arrive?  Let's take a look.

Here is the Infrared Satellite picture as of 11 am this morning

Infrared Satellite image as of 1801z (11:01 AM PDT) today (Aug 21st, 2019)

A clearly defined front was noted over southwest Oregon noted by the colder cloud tops (green and yellow shaded area) extending north up into western WA.  It was raining over most areas of SW Oregon.

Next we will take a look at GFS model projections going into this evening.

2 PM today

12z GFS forecast of MSLP and 700-500mb Relative Humidity valid 2 PM PDT Aug 21st, 2019

There are two items to keep your eye on. 
  1. Yellow lines which are lines of constant pressure.  The closer these are to each other, the stronger the winds.  Note at this time (2 PM) these lines are close together between Seattle and Omak (along the East Slopes of the Cascades) where breezy winds are likely.   
  2. Background image showing moisture content in the mid levels of the atmosphere.  Green is higher moisture content which is a more favorable area for rain while brown is dry areas.  So at this time a band of rain is progged to impact areas between Portland and Bend, with another area up over the North Washington Cascades.
5 PM today

12z GFS forecast of MSLP and 700-500mb Relative Humidity valid 5 PM PDT Aug 21st, 2019

Note now pressure packing of the yellow lines is spreading east into the Columbia Basin and thus increasing wind.  Rain chances are also beginning to spread east of the Cascades.

8 PM today

12z GFS forecast of MSLP and 700-500mb Relative Humidity valid 8 PM PDT Aug 21st, 2019

Note at this point the pressure packing of the yellow lines spreading east into Spokane and the Palouse with increasing wind for these areas.  Rain chances increasing across the Columbia Basin, and nearing the Spokane area and Palouse.

11 PM today

12z GFS forecast of MSLP and 700-500mb Relative Humidity valid 11 PM PDT Aug 21st, 2019

The burst of wind is progged to be moving out of the area into parts of Central Idaho and NW Montana.  While rain will likely be spreading into much of the eastern third of Washington into the Idaho Panhandle.

So how strong will the wind gusts be?  The potential exists for 30-45 MPH gusts across portions of the Columbia Basin, Spokane area, and Palouse as well as many area lakes.  Here is our forecast timing of the expected wind gusts.


And what about rain amounts?  All areas will have a chance for rain, with SE Washington into the Idaho Panhandle the most likely candidates for a wetting rain between a tenth to a quarter inch.


Thursday, July 18, 2019

EVAP! How thirsty is our ground?

Have you been watering your garden or yard less this month?  Some of you may have turned one of these off this week.


Well there is one way to measure the grounds need for water, and that is evaporation measurements.  These are taken on a daily basis from April 1st - September 30th at NWS Spokane near Airway Heights.  We call it EVAP for short.  Here is a picture of one of our forecasters adding water to the pan as part of taking today's measurement.

NWS Forecaster Jeremy Wolf adding water into the EVAP pan.  Picture taken 1 PM PDT July 18th, 2019
The main idea here is that the more water that is being added to the pan, the more "thirsty" the ground will be for water.  Another way of stating it is the more water being added, the more evaporation that has taken place in the past 24 hours.  Hot, dry, and windy weather will increase amount of evaporation while cool, wet, and light wind weather will decrease amount of evaporation.  Occasionally on wet days, we actually have to remove water from the pan, with a negative evaporation value for the day.

So, curious about the numbers?  Let's start with this month's value so far.  We will look at this year and compare it to each year since 2011.  If we sum up all the daily measurements from July 1st through July 17th, here is what we get.


The purple bar is this July showing less EVAP compared to the average line.  And much less compared to 2015 shown in red.  Recall that season was our big fire year.

Curious about June?  Were you watering a lot last month?

Answer: YES!  June EVAP was above average, with only 2015 surpassing it.  Recall that June 2015 Spokane recorded its hottest temperature on record (105 on June 28th).

What if we sum up these two charts.  Here is the June 1st-July 17th EVAP.

So while watering needs have been down so far this July, values since June are slightly above average. 

Expect watering needs to increase into early next week.  Today and Friday will have increased winds, as well as low relative humidity across the Columbia Basin, Spokane area, and palouse.

In fact, the jet stream overhead this morning set a record not just for today but for the month of July and August as noted by the black dot on the image below.


Wind speeds measured from balloon releases at 250mb (~30,000 ft) from all soundings from GEG/OTX from 1948-2014.  Black dot is July 18th, 12z observation

Then temperatures will warm significantly by early next week.

Here is the pattern for Friday, July 19th followed by Monday, July 22nd.

GEFS Forecast of 500mb heights and anomaly (shaded) for 5 PM PDT July 19th, 2019
GEFS Forecast of 500mb heights and anomaly (shaded) for 5 PM PDT July 22nd, 2019

Big change as low pressure digs off the coast with a much milder southwest flow.  Here is the change in temperature anomaly between July 19th and July 22nd as modeled by the GEFS.

GEFS 2 meter temperature anomaly (degrees C) for 5 PM PDT July 19th, 2019

GEFS 2 meter temperature anomaly (degrees C) for 5 PM PDT July 22nd, 2019
Translating from Celsius (from what the image shows) to Fahrenheit yields temperatures of 10-15F degrees below normal Friday to 5-10F degrees above normal Monday.  Get ready for more watering!

Thursday, July 11, 2019

2019 Fire Season Update

With the recent cloudy and wet weather of late (at least for this time of year), some folks are asking when will summer arrive?  Others may be wondering about the status of fire season.  We will look into these topics in this blog post.

Before we get to recent weather, let's briefly recap the longer term conditions as observed going into fire season.

October-June dryness

Long term precipitation deficits still exists for much of northern Washington into the north Idaho Panhandle.

 And the latest soil moisture anomalies reflect this long term dryness.

So despite some recent wet weather in the Cascades and across NE Washington into the North Idaho Panhandle soil moisture remains dry.  This is reflected in the latest drought monitor issued today.


Recent changes

But the weather pattern in late June and early July has changed.  There have been several rounds of showers and thunderstorms in the Cascades and across northern Washington into the Idaho Panhandle.  Here is a map (click image to enlarge) showing observed precipitation amounts since the first day of summer (June 21st)

Observed precipitation from June 21st-July 10th, 2019

In the Cascades most areas have been wet with most areas picking up between 1.00-2.25" of rain.  The northern valleys and mountains have been wet in some places (3.75" Metaline Falls) while not as wet in others (0.33" near Colville and 0.24" Omak).

Fire Potential update

Now the recent period of wet weather, as well as below normal temperatures to start off July has resulted in a slow start to the fire season with above normal fuel moisture in the timber.  This also implies below normal potential for forest fires for the time beingIf you want to see more, read on below to see data for different parts of our region otherwise skip down to the next section (A look ahead).

We will take a look at the Cascades, NE Washington, and the north Idaho Panhandle.  The following graphs are courtesy of the GACC (Geographic Area Coordination Center) which monitor fire potential across the country.

Here is a map showing the areas in Washington we will take a closer look at.  We will look at NW05, NW08, and NW09.

Map of NWCC Predictive Service Areas (PSA)
 
NW05 (East Slopes of the Central and Southern WA Cascades)

Graph of 100 hour fuel moisture for NW05 (East Slopes of the Central and Southern WA Cascades).  Red line is observed. Blue line is forecast. Light gray lines are max and min observed.  Dark gray line is average.

The time period runs from May 1st-August 1st.  Dark gray line in the middle of the vertical bars is average fuel moisture from historic data.  The red line is this years observed value while the blue line is forecast conditions out the next 10 days.  As you can see fuel moisture is running above normal and forecast to remain that way.  It is interesting to note the lowest values of fuel moisture were in early May when values were near record values for the time of year.

NW08 (East Slopes of the North Cascades, Okanogan Valley and Highlands)

Graph of 100 hour fuel moisture for NW08 (East Slopes of the North WA Cascades, Okanogan Valley and Highlands).  Red line is observed. Blue line is forecast. Light gray lines are max and min observed.  Dark gray line is average.


Similar story.  Fuel moisture is running above normal but the forecast has conditions becoming near normal in 7-10 days.  We will see about this.  Back in early May values were near record dry levels for that time of year.

NW09 (Northeast Washington)

Graph of 100 hour fuel moisture for NW09 (NE Washington).  Red line is observed. Blue line is forecast. Light gray lines are max and min observed.  Dark gray line is average.

Similar story.  Fuel moisture running above normal, some drying is forecast but still remaining slightly above normal.  Just like the Cascades fuel dryness was near record dry levels for the time of year back in early May.

NR01 - North Idaho Panhandle

Graph of 100 hour fuel moisture for NR01 (Northern ID Panhandle).  Blue line is observed.  Gray line is average. Red line is minimum observed.

A different color scheme on this graph with the blue line being the observed value.  Same story here with fuel moisture above normal.

Now these graphs do not address grass and brush.  We have already seen grass fires over parts of the Columbia Basin and around Elmer City.

A look ahead

So any hot and dry weather on the horizon?  Not likely as a large trough sets up over the region around the middle of next week.  Image below is for July 19th.

GEFS Forecast of 500mb heights and anomaly valid 18z (11 AM PDT) Friday, July 19th

This will likely deliver another round of below normal temperatures and maybe even some showers.  The 8-14 day outlooks from the Climate Prediction Center favors this.

CPC 8-14 day temperature outlook issued July 10th, 2019

CPC 8-14 day precipitation outlook issued July 10th, 2019

And latest CFS model shows the month of July likely finishing COOLER than normal for much of the Inland NW. Quite warm in Alaska!

CFS Model Forecast Temperature anomaly July 2019
And now precipitation.  Wetter than normal over western Washington, our northern mountains, and especially British Columbia.  This should greatly reduce our chances of British Columbia smoke making it into our region this summer unless a dramatic weather change arrives in August.
CFS Model Forecast Precipitation anomaly July 2019

So how about August?  The latest CFS model is going for normal temperatures and precipitation suggesting our current pattern may stick around.  However other climate models are leaning towards a warm August with a wide range in solutions for rainfall totals.  So at this time there is low confidence with how long this pattern will last so stay tuned.

Alaska fires  

There is one area that has had several fires, and that is Alaska where over 1.3 million acres have burned so far this year.  Several large fires are burning as the map below shows (bottom left part of image).

Map of active large fires July 11th, 2019

Here is a picture of one of those fires burning on June 29th, 2019.

The Rainbow 2 Fire burning approximately 15 miles west of Delta Junction on June 29th, 2019.  Photo courtesy of Alaska Division of Forestry