Thursday, July 18, 2019

EVAP! How thirsty is our ground?

Have you been watering your garden or yard less this month?  Some of you may have turned one of these off this week.


Well there is one way to measure the grounds need for water, and that is evaporation measurements.  These are taken on a daily basis from April 1st - September 30th at NWS Spokane near Airway Heights.  We call it EVAP for short.  Here is a picture of one of our forecasters adding water to the pan as part of taking today's measurement.

NWS Forecaster Jeremy Wolf adding water into the EVAP pan.  Picture taken 1 PM PDT July 18th, 2019
The main idea here is that the more water that is being added to the pan, the more "thirsty" the ground will be for water.  Another way of stating it is the more water being added, the more evaporation that has taken place in the past 24 hours.  Hot, dry, and windy weather will increase amount of evaporation while cool, wet, and light wind weather will decrease amount of evaporation.  Occasionally on wet days, we actually have to remove water from the pan, with a negative evaporation value for the day.

So, curious about the numbers?  Let's start with this month's value so far.  We will look at this year and compare it to each year since 2011.  If we sum up all the daily measurements from July 1st through July 17th, here is what we get.


The purple bar is this July showing less EVAP compared to the average line.  And much less compared to 2015 shown in red.  Recall that season was our big fire year.

Curious about June?  Were you watering a lot last month?

Answer: YES!  June EVAP was above average, with only 2015 surpassing it.  Recall that June 2015 Spokane recorded its hottest temperature on record (105 on June 28th).

What if we sum up these two charts.  Here is the June 1st-July 17th EVAP.

So while watering needs have been down so far this July, values since June are slightly above average. 

Expect watering needs to increase into early next week.  Today and Friday will have increased winds, as well as low relative humidity across the Columbia Basin, Spokane area, and palouse.

In fact, the jet stream overhead this morning set a record not just for today but for the month of July and August as noted by the black dot on the image below.


Wind speeds measured from balloon releases at 250mb (~30,000 ft) from all soundings from GEG/OTX from 1948-2014.  Black dot is July 18th, 12z observation

Then temperatures will warm significantly by early next week.

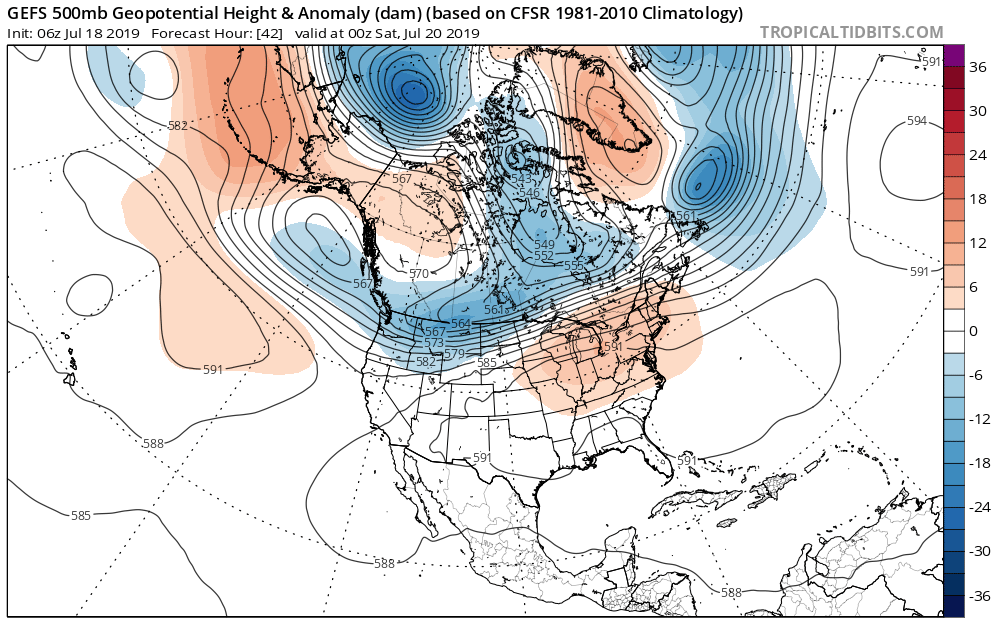
Here is the pattern for Friday, July 19th followed by Monday, July 22nd.

GEFS Forecast of 500mb heights and anomaly (shaded) for 5 PM PDT July 19th, 2019
GEFS Forecast of 500mb heights and anomaly (shaded) for 5 PM PDT July 22nd, 2019

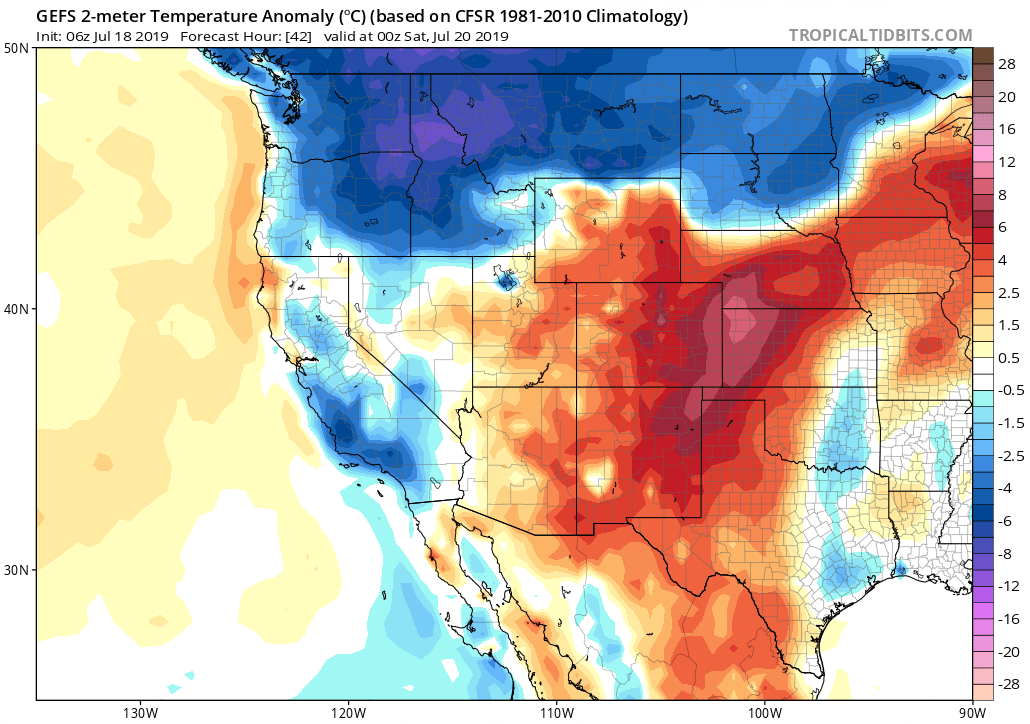
Big change as low pressure digs off the coast with a much milder southwest flow.  Here is the change in temperature anomaly between July 19th and July 22nd as modeled by the GEFS.

GEFS 2 meter temperature anomaly (degrees C) for 5 PM PDT July 19th, 2019

GEFS 2 meter temperature anomaly (degrees C) for 5 PM PDT July 22nd, 2019
Translating from Celsius (from what the image shows) to Fahrenheit yields temperatures of 10-15F degrees below normal Friday to 5-10F degrees above normal Monday.  Get ready for more watering!

Thursday, July 11, 2019

2019 Fire Season Update

With the recent cloudy and wet weather of late (at least for this time of year), some folks are asking when will summer arrive?  Others may be wondering about the status of fire season.  We will look into these topics in this blog post.

Before we get to recent weather, let's briefly recap the longer term conditions as observed going into fire season.

October-June dryness

Long term precipitation deficits still exists for much of northern Washington into the north Idaho Panhandle.

 And the latest soil moisture anomalies reflect this long term dryness.

So despite some recent wet weather in the Cascades and across NE Washington into the North Idaho Panhandle soil moisture remains dry.  This is reflected in the latest drought monitor issued today.


Recent changes

But the weather pattern in late June and early July has changed.  There have been several rounds of showers and thunderstorms in the Cascades and across northern Washington into the Idaho Panhandle.  Here is a map (click image to enlarge) showing observed precipitation amounts since the first day of summer (June 21st)

Observed precipitation from June 21st-July 10th, 2019

In the Cascades most areas have been wet with most areas picking up between 1.00-2.25" of rain.  The northern valleys and mountains have been wet in some places (3.75" Metaline Falls) while not as wet in others (0.33" near Colville and 0.24" Omak).

Fire Potential update

Now the recent period of wet weather, as well as below normal temperatures to start off July has resulted in a slow start to the fire season with above normal fuel moisture in the timber.  This also implies below normal potential for forest fires for the time beingIf you want to see more, read on below to see data for different parts of our region otherwise skip down to the next section (A look ahead).

We will take a look at the Cascades, NE Washington, and the north Idaho Panhandle.  The following graphs are courtesy of the GACC (Geographic Area Coordination Center) which monitor fire potential across the country.

Here is a map showing the areas in Washington we will take a closer look at.  We will look at NW05, NW08, and NW09.

Map of NWCC Predictive Service Areas (PSA)
 
NW05 (East Slopes of the Central and Southern WA Cascades)

Graph of 100 hour fuel moisture for NW05 (East Slopes of the Central and Southern WA Cascades).  Red line is observed. Blue line is forecast. Light gray lines are max and min observed.  Dark gray line is average.

The time period runs from May 1st-August 1st.  Dark gray line in the middle of the vertical bars is average fuel moisture from historic data.  The red line is this years observed value while the blue line is forecast conditions out the next 10 days.  As you can see fuel moisture is running above normal and forecast to remain that way.  It is interesting to note the lowest values of fuel moisture were in early May when values were near record values for the time of year.

NW08 (East Slopes of the North Cascades, Okanogan Valley and Highlands)

Graph of 100 hour fuel moisture for NW08 (East Slopes of the North WA Cascades, Okanogan Valley and Highlands).  Red line is observed. Blue line is forecast. Light gray lines are max and min observed.  Dark gray line is average.


Similar story.  Fuel moisture is running above normal but the forecast has conditions becoming near normal in 7-10 days.  We will see about this.  Back in early May values were near record dry levels for that time of year.

NW09 (Northeast Washington)

Graph of 100 hour fuel moisture for NW09 (NE Washington).  Red line is observed. Blue line is forecast. Light gray lines are max and min observed.  Dark gray line is average.

Similar story.  Fuel moisture running above normal, some drying is forecast but still remaining slightly above normal.  Just like the Cascades fuel dryness was near record dry levels for the time of year back in early May.

NR01 - North Idaho Panhandle

Graph of 100 hour fuel moisture for NR01 (Northern ID Panhandle).  Blue line is observed.  Gray line is average. Red line is minimum observed.

A different color scheme on this graph with the blue line being the observed value.  Same story here with fuel moisture above normal.

Now these graphs do not address grass and brush.  We have already seen grass fires over parts of the Columbia Basin and around Elmer City.

A look ahead

So any hot and dry weather on the horizon?  Not likely as a large trough sets up over the region around the middle of next week.  Image below is for July 19th.

GEFS Forecast of 500mb heights and anomaly valid 18z (11 AM PDT) Friday, July 19th

This will likely deliver another round of below normal temperatures and maybe even some showers.  The 8-14 day outlooks from the Climate Prediction Center favors this.

CPC 8-14 day temperature outlook issued July 10th, 2019

CPC 8-14 day precipitation outlook issued July 10th, 2019

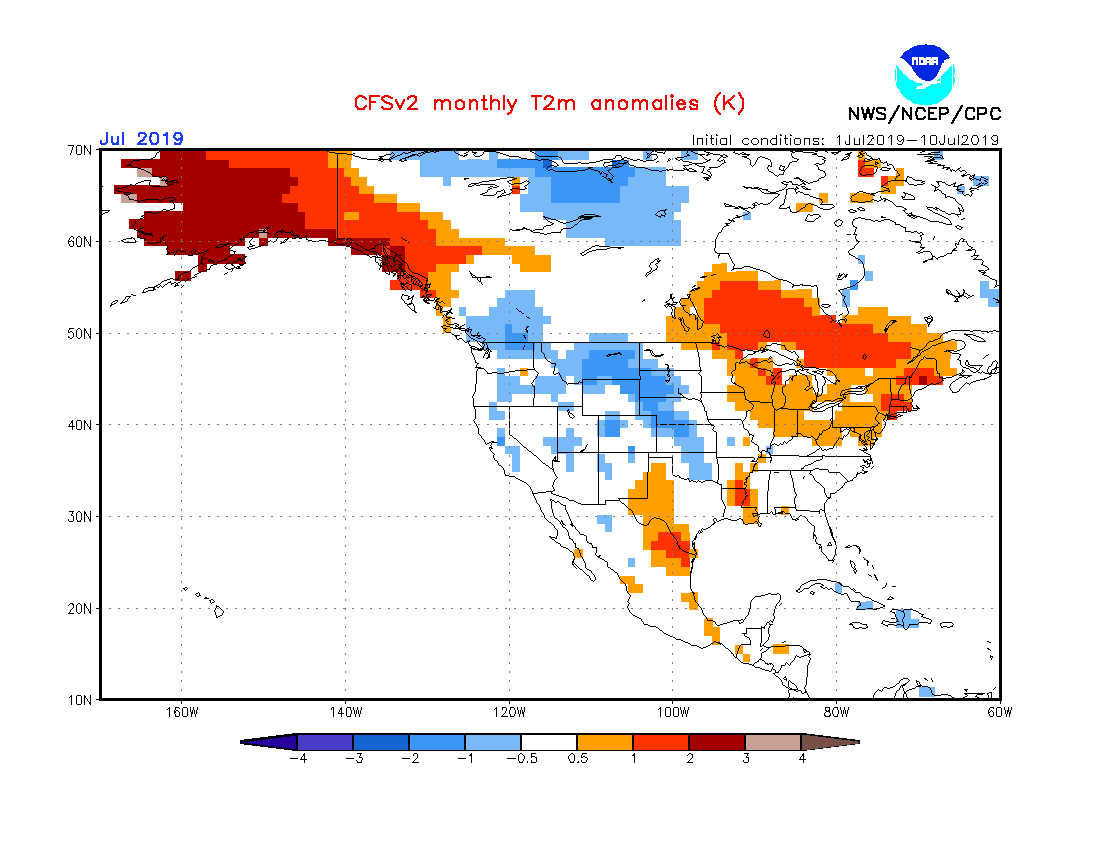
And latest CFS model shows the month of July likely finishing COOLER than normal for much of the Inland NW. Quite warm in Alaska!

CFS Model Forecast Temperature anomaly July 2019
And now precipitation.  Wetter than normal over western Washington, our northern mountains, and especially British Columbia.  This should greatly reduce our chances of British Columbia smoke making it into our region this summer unless a dramatic weather change arrives in August.
CFS Model Forecast Precipitation anomaly July 2019

So how about August?  The latest CFS model is going for normal temperatures and precipitation suggesting our current pattern may stick around.  However other climate models are leaning towards a warm August with a wide range in solutions for rainfall totals.  So at this time there is low confidence with how long this pattern will last so stay tuned.

Alaska fires  

There is one area that has had several fires, and that is Alaska where over 1.3 million acres have burned so far this year.  Several large fires are burning as the map below shows (bottom left part of image).

Map of active large fires July 11th, 2019

Here is a picture of one of those fires burning on June 29th, 2019.

The Rainbow 2 Fire burning approximately 15 miles west of Delta Junction on June 29th, 2019.  Photo courtesy of Alaska Division of Forestry

Tuesday, June 11, 2019

Drought Update

With recent drought declarations over portions of Washington State, we will take a look at the latest drought situation and conclude with a brief update on the fire season outlook.

Let's begin with the US Drought Monitor depiction as of June 4th, 2019.

US Drought Monitor - June 4th, 2019

As you can see, most of the country is free of drought with a few exceptions.  One of those is across portions of Washington and the Idaho Panhandle.  This product is updated every Thursday.  The latest version can be found here

This is a major change compared to last year!  Here is what the situation looked like one year ago where drought  covered much of the southwest and portions of eastern Oregon.

US Drought Monitor - June 5th, 2018

Now let's take a look at our current situation, beginning with a zoomed in look at our region.

US Drought Monitor - June 4th, 2019

Moderate drought conditions exists along the East Slopes of the Cascades, as well as up around Northport, Metaline Falls, Bonners Ferry, and Sandpoint.  Abnormally dry conditions are noted by the yellow shading on the map.  Severe (D2) drought is noted over parts of Western Washington.

When looking at drought, we often analyze both short and long term conditions.  We will begin with the month of May which was 2-4 degrees warmer than normal for most locations.


And now May precipitation


May brought some much needed precipitation over Okanogan and Chelan counties where moderate drought conditions exists.  May was much drier than normal over extreme NE Washington and the north Idaho Panhandle. 

The warm May resulted in snow melting off a few weeks early in the mountains.  Here is Schweitzer Basin SNOTEL near Sandpoint, ID

Schweitzer Basin SNOTEL - Snow Water Equivalent (SWE) 

The black line is this year while the dark green line represents a normal melt off.  And here is Harts Pass located high up at 6500 feet along the Cascade crest northwest of Mazama, WA

Harts Pass SNOTEL - Snow Water Equivalent (SWE)

Now let's look at some longer term conditions beginning with percent of normal precipitation October through May.


Precipitation since Oct 1st has been below normal over western Washington, and most of northern Washington into the Idaho Panhandle.

There are several drought indicators that are analyzed.  One of them is the Palmer Drought Severity Index (PDSI).  This looks at long term precipitation and temperature data to access drought conditions.  Yellow, orange, and red colors side towards drought conditions.


Another indicator is stream flow.  Here is the latest 7 day stream flow compared to historic stream flow for Washington and Idaho for June 10th, 2019.


Below to much below normal values currently in the same drought depicted areas.  And finally here the summer stream flow forecast


The dots are small, but a close eye can see the orange colors around Chelan, Omak, and Sandpoint which indicates 50-75% of normal water supply this summer.  Southeast Washington is looking much better.

Drought conditions have led to below normal soil moisture over portions of northern Washington.  This could make the grass and timber more susceptible to fire starts this summer.   But how many fires and number of acres burned will depend on how many critical fire weather patterns set up as mentioned in previous blog post here

Here are the latest fire outlooks from NIFC issued June 1st. 


These update on the 1st of each month and can be found here.  The key word in this outlook is potential.  The potential exists for an above normal fire season in northern Washington into the north Idaho Panhandle, but doesn't guarantee one.  We will continue to monitor the drought and fire situation as we go through the summer.

Friday, May 10, 2019

Fire and Summer Outlook

With the warm and dry start to May, you may be already thinking about summer and what kind of fire season lies ahead.  There have already been some folks comparing this year to 2015.  In this blog we will discuss the outlook for the upcoming fire/summer outlook so let's get to it!

2015 Fire Season

Let's begin with a comparison of this year to 2015.  For those new to the area, 2015 was an extremely active fire season burning over 1 million acres across Washington State.  That year featured a very low snow pack, a record hot June for many areas, and a dry summer.  This primed the land for several large fires when dry lightning and windy weather entered the region in August. To put that year in perspective, here are acres burned by year since 1970 for our region which includes most of Central and Eastern Washington and the North Idaho Panhandle.

Number of acres burned each year since 1970 in Spokane Fire Area which includes most of Central and Eastern Washington and the Idaho Panhandle.

So while over a million acres burned in Washington State, our region (most of Central and Eastern Washington and north Idaho) was hit especially hard with over 900,000 acres burned.  We can also see from this graph that we have had several active fire seasons since 2012.

2019 versus 2015

With some folks comparing this year to 2015, we need to look at some comparison maps of where we stand now compared to 2015.  Shown below are images from April 1st when snow pack typically peaks.  First image is 2019 and then 2015.

April 1st, 2019 SWE % of Normal

April 1st, 2015 SWE % of normal

As one can see in 2015, snow pack was in far worse shape on April 1st.  What does our current snow pack look like as of May 9th compared to around this same time in 2015?

May 9, 2019 SWE % of normal


May 11th, 2015 SWE % of normal.

Our snow pack in 2015 was again far worse compared to this year.

What about precipitation?


Conditions are actually drier this year compared to 2015 over the Cascades, northern Washington, and the Idaho Panhandle and wetter over parts of the Columbia Basin and SE Washington.  But is has been exceptionally dry over the past 30 days over most of the region as noted below.


Does low snow pack and dry winter/spring mean a bad fire year?

Let's tie this all together.  Does a below normal snow pack and a dry winter/spring mean another bad fire season?  Not necessarily.  We did a correlation to number of acres burned each season since 1970 and compared it to several factors including April 1st snow pack, October-May precipitation, number of lightning caused fires, and late spring/summer temperatures.

The most important factor is May-August temperatures followed by number of lightning caused fires.  This makes sense as a hotter summer typically brings dry conditions and makes the grass and timber readily available to burn.  But still this correlation by itself isn't very high as number of acres burned depends how many times a critical fire weather pattern sets up as hot temperatures won't start fire by itself.  2015 is a prime example as that season wasn't exceptionally busy locally until August 10th when the critical pattern set up with dry lightning and several rounds of windThe fires that had a start date between Aug 11-25 consumed 834,623 acres.  It is worth noting that mountain snow pack on April 1st has a very low correlation and amount of winter/spring precipitation has nearly 0 correlation to number of acres burned during fire season.  So this summer we will be closely monitoring summer temperatures and watching critical fire weather patterns.

Pattern change
The dry weather over the past 30 days will result in elevated chances for fire spread this weekend as the winds begin to increase on Sunday (May 12th).  The pattern looks to change towards the end of next week with wetter than normal conditions favored May 16-20th.


Climate Prediction Center 6-10 day precipitation outlook valid May 16-20, 2019

Summer/Fire Outlook
So since summer weather ultimately decides what kind of fire season we'll have based on the local study mentioned above, what can we expect?  Let's begin with temperatures.  No surprise here with elevated odds of warmer than normal.

CPC June-August 2019 Temperature Outlook issued April 18th, 2019

Why is this no surprise?  Because our summers have been trending warmer at each location since 1900 as shown below.

Summer (June-August) temperature trends since 1900 as plotted from the OWSC Trend Analysis Tool

The big red circles show a significant warming trend, while the smaller red circles also show warming, but the trend is considered insignificant in terms of long term trends.  The plot above as well as the few that follow can be generated from the Office of Washington State Climatologist Trend Analysis tool found here 

Below is a graph showing average temperatures in Spokane since 1900.  The past four summers are highlighted in red and have been noticeably warm. 


What about precipitation this summer?  The summer's of late have been quite dry, especially in Spokane as shown below.


The past four summers (June-August) in Spokane have brought less than 1.00" of precipitation, something that hasn't been accomplished for more than two consecutive summers since 1900 until now.  Normal June-August precipitation is 2.48".  Will we make it five in a row?  Let's see what the Climate Prediction Center is saying.

CPC June-August 2019 Precipitation Outlook issued April 18th, 2019

Slightly elevated odds of wetter than normal conditions for SE Washington into the Idaho Panhandle with Equal Chances elsewhere.  What kind of pattern would result in this?

NMME Forecast issued early May of precipitation anomalies June-August 2019

The pattern would be high pressure off the coast deflecting systems into Alaska and down into Eastern WA/N Idaho and the Northern Rockies as the NMME (National Multi-Model Ensemble) shows.  This could give Eastern WA/N Idaho periods of cooler and showery conditions.  But getting this pattern nailed months in advance is nearly impossible for the models to get right.  That area of high pressure could set up further east over our region giving hot/dry weather.  Or it could set up slightly further west providing occasional rounds of cool/wet weather.  There is low confidence of this occurring.

Here are the official National Fire Outlooks for July and August.

National Fire Outlook issued by NIFC May 1st valid for July 2019

National Fire Outlook issued by NIFC May 1st valid August 2019
These get updated on the 1st of each month.  For the latest outlooks, go here

Summary
Given all the factors that came together in the 2015 fire season, 2019 is likely to not be a repeat but could still be an above normal season.  The dry weather pattern as of late is expected to change in the May 16-20 period with wetter than normal conditions as well as cooler temperatures.  Going into summer warmer than normal temperatures are favored while precipitation is more of a wild card.  The Fire Potential Outlook for this summer favors above normal for western Washington, and the northern valleys and mountains with near normal potential elsewhere.