Thursday, October 20, 2022

Goodbye Smoke, Hello La Nina!

 The calendar may say it's October but the weather this month has felt far from it.    

And while wildfire smoke is common in August and September, having so much of it this late into October is unusual.  Here is the air quality map as of 5 am this morning.

5 AM Oct 20th Air Quality readings

Very unhealthy and even hazardous air around Seattle, and Lake Wenatchee.  For the latest readings head to fire.airnow.gov.  West winds today may bring some of the Seattle smoke into parts of Eastern Washington but a stronger weather system on Friday will clear much of the smoke out.

Want proof of how unusual this is so late in the year?  Below is a tile plot courtesy of EPA showing average daily AQI values for Wenatchee, WA since 2005.  

Average Air Quality values for Wenatchee, WA since 2005

The bottom row in the chart is this year, where unhealthy air (red colors) is still evident and the latest it has stuck around since 2005.  Those in Wenatchee may remember the 2012 episode which also did carry on through October 11th.  Data for this site along with many others can be found here.

The dry conditions over the past 4 months have been quite noteworthy as the percent of normal precipitation map below shows.


The driest areas relative to normal are where many of the active wildfires continue to burn (Cascades, far NE Washington, and the North Idaho Panhandle).

And then there is this month where max temperatures have been running well above normal.  Several cities have set a record for the number of 70+ degree days for the month of October.  High temperatures have been running 10-15 degrees above normal, and approaching 20 degrees above normal in the Washington Cascades.  

Max Temperature Anomaly (degrees F) Oct 1st-Oct 18th, 2022


And the month thus far has been very dry.  The reason is a persistent ridge of high pressure over the area.

500mb height anomaly Oct 1-17th, 2022

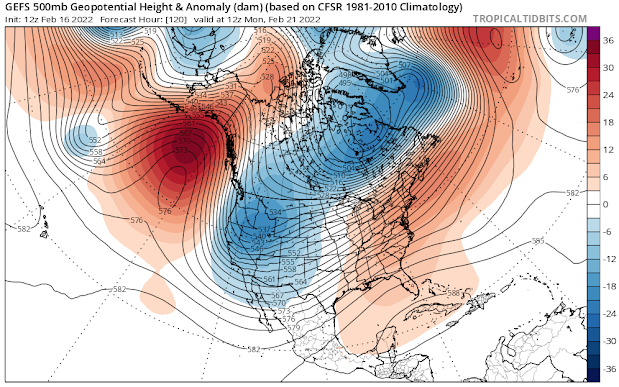
Ok enough talk about the smoke and dry weather, what about the big change for the upcoming weather pattern?  The stubborn ridge is going to move west, allowing a much cooler weather pattern to settle in.  Here is one model depiction of the change.  The loop starts with yesterday (Oct 19th) and goes out through Oct 26th.  You will notice a shift in the high pressure to the west allowing a series of cool weather systems to drop in from the northwest.

GEFS model of 500mb heights and anomalies Oct 19-26, 2022

What do the surface temperature anomalies look like with this pattern shift?  Going from a large area of warming over western North America to cooling.

GEFS model of 2 meter temperature anomalies at 5 PM PDT each day Oct 19-26, 2022

This cool and wet pattern will surely give the mountains their first snow of the year.  And with multiple systems the snow may pile up over the Cascades, the Rockies, and portions of the ID Panhandle.  Of course precise amounts several days out may change, but here is what one modeling system is showing through October 26th.

NBM forecast snow amounts Oct 20-26, 2022

Overall this change in the pattern is more typical of La Nina.


La Nina winters tend to favor cooler and wetter than normal conditions.  Of course this is never a guarantee, as other variables can influence the weather patterns at times.  

La Nina tends to favor above average snow especially along the Cascade crest, Palouse, and Lewiston area. A map showing La Nina Snow Climatology from 1950-2017 can be found below.

Percent of normal snowfall average for La Nina winters 1950-2017

An interactive version can be found at this link.

And hot off the press, here is the updated CPC Winter Outlook released this morning.

Climate Prediction Center December-February Temperature Outlook issued Oct 20th, 2022

Climate Prediction Center December-February Precipitation Outlook issued Oct 20th, 2022

No surprises with these outlooks given the forecast La Nina.

Say goodbye to the smoke as a major change in the weather pattern is imminent!


Wednesday, May 18, 2022

Is this the Coldest Spring Ever in the Inland NW?

The most-talked about topic lately has to be the cold spring we're having this year in the Inland Northwest.  Have we ever had a spring this cold?  What is causing this?  Will it ever warm up?

First we'll talk about what has happened.  Here's a time-series of temperatures at Spokane Airport from January 1st through mid-May.  A little explanation for those who are not used to this style of graph.  The blue bars show the high and low temperature each day.  The brown area is the range where the temperatures are normal for that day.  If the blue bar extends above the brown area, into the red area, then that day was warmer than normal.  If the blue bar is below the brown region, into the light blue area, then that day was colder than normal.


As you can see from the graph above, temperatures in Spokane for January through March were generally at or above normal (in the brown or red shaded area), with the exception of the cold snap in late February.  But then in early April, the blue bars took a significant dip, and since then, they've been generally been in the brown (normal) or blue (below normal) territory.

Here's another way to look at our spring, with a bit larger view.  March was very mild across the entire lower 48 states.  For some counties, the temperatures were in the Much Above Average category, including Spokane County. 


April was a much different story for the country.  The Pacific NW had Much Below Average temperatures, as did Montana to Wisconsin.  Notice that a few Washington counties (Lincoln, Grant, Benton and Walla Walla) had their coldest April ever.  That's an impressive record considering that records go back to 1895, or 127 years.  Meanwhile, it was much warmer than normal across the southern states in April.


For you weather buffs, when we see colder-than-normal across the north, and warmer-than-normal across that south, that will typically mean windier-than-normal weather in the area in between.  And in fact, it has been very windy this spring in the southern/central plains, from Texas to Nebraska.

Of course, all of this cold weather has resulted in some unusual events.  Hard to plant a garden when there's still frost in the forecast. The most impressive was probably the heavy snow in the Wenatchee area on April 14th.


And of course, there's the "first 70°F day" record for Spokane.  While Felts Field near downtown Spokane has hit 70°F twice this spring, Spokane Airport, the official observation site, yet to reach the 70°F reading.  How unusual is this?  Actually, it's never happened before in the 75 years of the Spokane International Airport.  Typically Spokane Airport will have reached 70°F by April 18th.  

Before this year, the record for the latest first 70°F day was all the way back in....2011, when we didn't reach 70°F until May 11th.  What's more interesting, that same year of 2011 it took until June 22 to reach the first 80°F day, which was also a record.  

So why all the cold weather?  La Nina is the most likely culprit.  Cool weather in the northwest U.S. fits the pattern of most La Nina's, especially in the spring.


For the first 3 months of 2022, the jet stream (black line) was being deflected up and over the Pac NW, leaving us on the warm side of the jet.

Then in late March and early April, the pattern changed considerably.  The jet stream was generally south of us, leaving us on the cold side of the jet.


So what does this mean for our upcoming summer?  The official outlook from the Climate Prediction Center shows above normal temperatures for June-July-August, but the center of this heat is well to the south and west of the Pac NW.


The computer forecasts for this period show a similar outlook, with the largest anomalies over the West, but not so much over in Pac NW.


As we've already seen, the spring of 2011 was rather similar to our current spring.  So of course this begs the question, what was the summer of 2011 like?  Now, using another year as an analog is often risky business.  But 2011 was a La Nina year, similar to 2022.  First, here's how April 2011 turned out as far as temperatures.  If you compare it to the April 2022 ranks at the start of this blog, there's a lot of similarities.


The cool weather persisted in the West during June of 2011, while Texas had it's hottest June ever. 


July wasn't much different, with the West staying cooler than normal, the East was warmer than normal and Texas and Oklahoma were still hot.


But by August, the pattern had changed a bit, with temperatures more typical for summer in the West, while the Southwest continued to sizzle.


Lastly, September was quite different from the summer, with very warm conditions in the West and Northeast.


Thursday, April 14, 2022

Historic April Snowstorm hits Wenatchee

Many woke up to a surprise snowstorm in the Wenatchee area this morning, catching even us meteorologists by surprise.  Scenes like the ones below were common around Wenatchee.


Courtesy WSDOT

The April snowfall record for the Wenatchee Water plant was only 0.5", so seeing reports like the one's below is mighty impressive!

Snow reports received Thursday morning, April 14th, 2022 around the Wenatchee area

Wow!  Reports ranging from 7-10" in town with one report of 16" south of town.  

Was this expected?  Well here was the forecast for the Wenatchee area issued the afternoon before.


As you can see only a 20% chance of snow.  So how did things go horribly wrong?  And what caused this anomalous event?  Let's take a look

There was a cold and unstable low pressure system near the Wenatchee area Thursday morning.  Here is one model showing a large pool of cold air aloft (purple and pink shading) over Washington and North Idaho.  With the center of low just to the south of Wenatchee, there were no downslope westerly winds to contend with which is more common for Wenatchee.


But just cold air isn't enough to create snow, rising motion in the atmosphere is needed.  Below is a satellite loop from 5 AM- 8 AM PDT this morning showing cooling clouds tops associated with the upward motion of the atmosphere around the Wenatchee area. 

GOES 17 Infrared Satellite Loop 5 AM - 8 AM PDT April 14th, 2022

This was a small scale feature that models often have a hard time capturing ahead of time.  Often the focus of heavier showers is over a small area.  What did the models have to say before the event?  Here are five of the higher resolution models that were initialized at 5 AM the previous morning (Wednesday).

As you'll see they all indicated a small feature, but most solutions had the band of showers south of Wenatchee (located at red dot on each image).

HRRR forecast of composite radar reflectivity issued 5 AM Wednesday valid 7 AM Thursday.


NSSL forecast of composite radar reflectivity issued 5 AM Wednesday valid 7 AM Thursday.

ARW model forecast of composite radar reflectivity issued 5 AM Wednesday valid 7 AM Thursday.

FV3 model forecast of composite radar reflectivity issued 5 AM Wednesday valid 7 AM Thursday.

NAM Nest forecast of composite radar reflectivity issued 5 AM Wednesday valid 7 AM Thursday.

And another model showing 24 hour snow accumulation from the UW WRF-GFS shows accumulations south of Wenatchee.

UW WRF-GFS forecast of 24 hour snowfall issued 5 AM WED valid 5 PM WED-5 PM THU.

Based on the above, a 20% chance of snow doesn't seem like too bad of a forecast.

How about some of the ensemble forecasts?  The 5 AM Wednesday UW Ensemble plumes of snow forecasts weren't too excited about heavy amounts of snow in Wenatchee but there were a few solutions going for more than 1".

UW 4-km Ensemble plumes for Total Snowfall initialized 5 AM Wednesday - Wenatchee

Notice that most model projects solutions have less than 1".  But what a change with the next set of model forecasts that came in just 12 hours later...with a mean of 5" with several members showing  7" or more.  


UW 4-km Ensemble plumes for Total Snowfall initialized 5 PM Wednesday - Wenatchee


This is one scenario where forecasts can change so quickly.  Small but unstable spring time low pressure systems can create localized areas of heavy snow.

This was a much different type of storm, compared to the record snow storm that hit Wenatchee earlier this year.  A blog discussing this setup prior to the snow arrival can be found here.  This has been the year for record Wenatchee snow events!

We still have this cold low sitting over the region.  Where will the next local snow storm strike?  We will be keeping a close eye on things, and for the latest forecasts please visit weather.gov/spokane

Wednesday, February 16, 2022

Colder than Normal for End of February


Like it or not, weather changes are in the forecast.

Colder than normal temperatures are predicted for next week. The 6-10 Day Outlook issued by the Climate Prediction Center on 16 February calls for a 70-80% chance of below average temperatures for eastern Washington and northern Idaho.

Climate Prediction Center: 6-10 Day Outlook issued 16 Feb 2022
https://www.cpc.ncep.noaa.gov/

Compare the 6 to 10 Day Outlook (above) to the temperature anomaly map over the last 30 days (below). It looks like the atmosphere will undergo quite a flip-flop. Since mid January, much of the Western U.S. and High Plains experienced above average temperatures.

Climate Mapper: https://climatetoolbox.org/tool/Climate-Mapper


And since mid January, the persistence of a high pressure ridge along the Pacific Coast has lead to much drier than average conditions for Washington, Idaho, and the rest of the Western U.S.

Climate Mapper: https://climatetoolbox.org/tool/Climate-Mapper


Below is a map of the weather pattern we have been influenced by over the past 30 days (January 15th through February 14th).  The bulge along the Pacific Coast (red, orange and yellow colors) illustrate the mean position of the upper level ridge axis during the last 30 days. 
500mb Geopotential Height Composite Mean for 30 days (Jan 15 - Feb 14)
NOAA Physical Sciences Laboratory
https://psl.noaa.gov/data/composites/day/

This kind of pattern (ridge over the West and trough in the East) looks pretty close to the Typical La Nina pattern. Check out the illustration below. However if you look closely, the ridge axis on the 30 day map above is further east (closer to the coast) than the typical La Nina pattern. 


Typical La Nina Winter Pattern: Source NOAA

The map below probably demonstrates the orientation and amplitude of the 500 millibar ridge axis more clearly. This anomaly map depicts the 500 millibar difference from average for the last 30 days. The reds and oranges illustrate the strength of the upper level ridge along the coast of Washington and southern British Columbia.  Unusually high height anomalies along the coast of Washington and southern British Columbia imply that the Polar Jet Stream further north than we typically experience during the winter months. Subsequently, our typical "wetter" than average La Nina pattern has been interrupted since mid January.
500mb Geopotential Height Composite Anomaly for 30 days (Jan 15 - Feb 14)
NOAA Physical Sciences Laboratory
https://psl.noaa.gov/data/composites/day/

Changes are on the way! Over the weekend of 19-20 February, there is strong model agreement of a major pattern shift. By Monday (Feb 21st), the West Coast ridge of the last 30 days will be replaced by a cold upper level trough. The blue colors represented on this 500 millibar forecast from the Global Ensemble Forecast System (GEFS) represent anomalously low heights across the Western U.S. The north to south orientation of the black lines from the Northwest Territories into northern California indicate strong northerly flow aloft.


https://www.tropicaltidbits.com/


Northerly flow aloft means the Western U.S. will be vulnerable to cold air intrusions from the Arctic. By Monday evening the GEFS (GFS model ensembles) depicts strong cold anomalies plunging into the High Plains. While most of the coldest air is expected to remain east of the Continental Divide, the states of Idaho, Washington, and Oregon will likely receive a shot of a colder than average air mass.

https://www.tropicaltidbits.com/

The Global Ensemble Prediction System (Canadian) shows a similar surge of cold air into Montana, Wyoming and the Dakotas by Monday evening. However, anomalies are not progged to be quite as cold over Washington and north Idaho.

https://www.tropicaltidbits.com/

Cold air intrusions and periods of dry weather can be common during La Nina in the Pacific Northwest. The strength and position of high pressure over the eastern Pacific can vary through the winter. So far this winter, the Inland Northwest has experience periods of heavy precipitation in November and December, record snows in central Washington in January (nearly 2 feet in Wenatchee on January 6th), and unusually dry weather from mid January to mid February.

It's unclear at this time how long the below normal temperatures will last.  The coldest days are forecast to be between Feb 21-23rd, but below normal temperatures could last through the end of February.

Saturday, February 5, 2022

I thought La Nina meant cold and snowy weather.

In our last blog entry, we were stuck in a dry ridge of high pressure in mid January, wondering if winter was over.  The computers were giving hints that the pattern would change right around the time the calendar changed from January to February.   And that actually panned out.  This was quite impressive for a 10 to 14 day forecast.  The problem is, the "cold snap" of early February only lasted a whopping 2 days.  (The blue bars in the image below show the daily high and low temperature.  Blue bars below the brown shading are below normal temperatures).


So instead of changing the weather pattern to colder/snowier for the Northwest, we only had a short cold snap. 

There's an index that forecasters monitor that's called the Arctic Oscillation.  It's pretty difficult to explain and even more difficult to see by looking at weather maps.  But it does tend to track pretty well with our weather.  Here's the AO for the current winter:


You can clearly see that when the AO index goes negative, we tend to have cooler weather here in the Northwest.  Even our 2 day cold snap shows up in the AO.  Unfortunately, it's difficult to forecast the AO out beyond more than a couple of weeks.  Here's the GEFS forecast (red lines) for the AO over the next two weeks.  Pretty much assured of a positive AO through mid-February.


Here's the GEFS pressure forecast for 9-14 February.  The red/orange shading over the West indicates dry and mild weather for our area, while the blue shading over the eastern US points to more winter weather for them.


By 15-20 February, the GEFS model suggests that the high pressure will shift a bit to the west, off the West Coast.  This shift could allow some weather systems to move through our area from the northwest.  But those are typically drier storms, so this pattern wouldn't be very wet for our area. 


If we really look far into the future (23-28 February), the GEFS would imply that the high pressure would move even farther offshore, allowing the cooler/stormier weather to impact the western US.  Still, this isn't a real wet pattern for the West.

The GEFS model has actually been showing this pattern shift for a few days now.  Additionally, the European model has been doing the same.  So there's a small amount of confidence that we could see stormier weather return by the last week of February.  But forecasting the weather 3 weeks in advance is risky business.

All of this brings up the question:  is our recent dry spell leading us back into a drought?  Here's the accumulated precipitation for Spokane since October 1st. The brown line is what our precipitation should look like in an average year.  The green line and shading shows our precipitation for this winter.  

You can see that we started off dry in October (green line is lower than the brown line).  But then we quickly caught up to normal and we were actually wetter than normal in November (green line is above the brown line).  Then our mild December dropped us back onto the dry side.  But our stormy weather after New Year's brought us back to normal.  Unfortunately, we've fallen behind again in the past 3 weeks.  Mind you, we're only 0.7" below normal, and we can make that up in a hurry.  But as we just showed you, we're probably not going to see much precipitation for the next 3 weeks.  By then our precipitation deficit will probably be about 1.5".

The image below is the same as what we were just looking at, except we've added the precipitation trace for the previous winter (2020-21) in purple.  It's sort of scary how similar it is to our current winter.  And we all remember how dry things were around here last spring and summer.


At this point in the winter, our mountain snow pack is looking good; right about where it should be (green colors indicates snowpack is normal).  Of course, we'll see these number drop a bit as we go through these next 3 dry weeks.


Looking farther into the spring, the average of the climate models expect cooler-than-normal temperatures for the Northwest US February-April.


And wetter than normal conditions for the same 3 months.  


This pattern is consistent with what we usually see for La Nina during the spring.  Obviously last year's La Nina didn't live up to those expectations.  We'll see how this La Nina round #2 fares.