Showing posts with label winter storm. Show all posts

Friday, November 4, 2022

Storm Part 2...Will your house have electricity in the morning plus a look beyond?

There's a good chance of seeing multiple power outages tonight with our upcoming wind storm.  And depending on how many outages there are, our much-appreciated hard working utility folks may not have all the power back on before you get up Saturday morning.  As such, you may want to make some contingency plans.  It would be a good idea to charge your battery powered devices this evening just to be safe. 

Round 1 of our storm series is over. The main result of it was heavy snow which fell over many parts of the Inland Northwest overnight and into this morning.  It is very unusual to have this much snow this early in the season, let alone for the first snow of the season. Here are the morning snow totals.  Since it snowed much of the morning, these totals will likely increase from what's posted here.


Now it's time to get ready for Round 2 and it could be a doozie: the wind storm.  The various computer models have their usual disagreements, but they're all saying it's going to be windy tonight.  One chart we often look at for wind events is the 850 mb wind forecast.  Think of this as the winds about 3000-5000 feet elevation.  Usually a wind of about 50 knots (58 mph) will get our attention.  In this instance, the GFS is forecasting 65 to 78 knots of wind tonight!  Other models so something of a similar magnitude.

850 mb winds for 11PM Friday

So the question is: can that wind that is 3000-5000 feet overhead mix down to the ground?  The answer is quite complicated and difficult to answer.  Meteorologists often struggle with this a lot.  In some instances, those strong winds above us stay above the ground and we never feel them.  But there are situations where those strong winds do make it to the surface.

One of those mechanisms is cold fronts.  And that's exactly what we'll have moving through our area tonight.  The front is moving west to east, and will go through Spokane around 1am tonight.  Before that, the rain in the Spokane area will taper off around 6pm, and then the winds will begin to crank up.  It will be windy with gusts up to 50 mph late this evening and then the front plows through. We still think there is a good chance that when the front goes through, we will see wind gusts in the 60-70 mph range for some locations.  The damaging winds should begin to taper off  before sunrise Saturday.

Here's the peak wind forecast.  Keep in mind that the valley locations like Colville and Republic may not see the highest wind speeds, but they have more trees to potentially knock down and thus produce more power outages. 


So what can we expect from an event like this?  At this point, there are some similarities between this event and the 13 Jan 2021 event.  That event had 850mb winds of 57 knots just before the cold front came through, which resulted in a gust to 71 mph at Spokane Airport.  But similar to tonight's event, the strong winds only lasted about 3 hours.  Still, the tree damage was significant, and power outages lasted for several days in some locations.


After the wind storm, we aren't done with the active weather, we still have Rounds 3 and 4 to contend with. 

Round 3 promises to deliver more snow, and in some cases it could be significantly more than what we just saw. The heaviest snow possibilities are honing in on north-central Washington.  The surface low will track south of us, which favors that part of the Inland NW due to easterly low-level winds pushing into the Cascades. This will cause rising air over much of that area, rather than the more typical downslope/rain shadow effect.  Snow should start there on Sunday morning.

Surface low position (off Vancouver Island at 11 am Sun) and precipitation

But since this low is tracking south of us, the front will move very slowly across the region.  It won't reach extreme eastern WA and the Panhandle until 24 hours later, Monday morning.

Surface low position and precipitation as of 11 am Monday

Here's the current forecast storm total snow for this event.  


And lastly, Round 4 will be the unusually cold temperatures that move into the region behind this storm.  There's a good chance that some locations will break daily records.  Here is a list of the record highs which could be broken (denoted in yellow):


As well as the record lows (denoted in yellow):


If there are widespread power outages from the wind or upcoming snow event, the cold temperatures next week could have a much bigger impact than they usually would. 


Monday, March 21, 2016

UPDATED....Is a significant snow event possible for Spokane,Coeur d'Alene or the Palouse late tonight and tomorrow morning?

So as we talked about yesterday, an unusually tricky weather scenario looks like it will unfold over the Inland Northwest. So what are we fairly certain about? We are fairly confident that a slow moving upper-level low-pressure system will take up residence over the Inland Northwest and produce a band of moderate to locally heavy precipitation. The big questions to answer are where is this band going to set up and will it cool the atmosphere enough that we could see some significant snow. The setup producing the unusual event looks quite similar to what we discussed in our previous blog. We still expect to see strong lifting associated with a slow moving upper level low parked somewhere over eastern Washington. Notice the green shaded area (representing upper-level moisture) remains parked over eastern Washington and the central Idaho Panhandle through much of Tuesday.


500 mb pattern 2am Tue-5pm Tue
The lifting from the low will be accompanied by plenty of moisture and instability which should be perfect for producing a band of precipitation. Just how much precipitation are we talking about? A lot to say the least. The areas in purple represent totals between 0.50-1.00 inches of liquid and the reds and yellows equate to amounts between 1.00-1.50 inches. This is for the 12 hours between 2am through 2 pm Tuesday. Notice the band of heavy precipitation has eeked farther north than what we were looking at in yesterday's forecast and blog.

Latest 12 hr precipitation forecast 2am Tue-2 pm Tue

Previous 12 hr precipitation forecast for 2am Tue-2pm Tue

We still highly suspect that whatever verifies from a precipitation standpoint will more closely resemble the top two panes showing a heavy east-west oriented band vs the more poorly defined precipitation blob in the lower two panes.

Since the forecast is nearing in time we can also use one of our favorite tools called the HRRR (a rapidly updating model that runs hourly and can ingest current weather conditions). Let's see what the latest run of it says. The loop below is a simulation of what the radar is expected to look like. Green and yellow shading indicates where the heaviest precipitation is expected.

Radar simulation for Tuesday morning

So this also boosts our confidence that this event is going to occur. Each subsequent run of this model continues to show a similar radar formation (with small variations in location).

Now the largest problem remains is will the temperatures cool down enough to support snow. The models vary in this regard and there is a fine line as to whether or not snow can fall and then whether it will get heavy enough so it can accumulate on roads. The odds of rain changing to snow over the Inland Northwest look fairly good especially over Idaho and southern Spokane County and northern Whitman County. However a tougher question to answer is will the snow be able to accumulate on the area roads? If the snow gets heavy enough the answer is yes, however if not, most of the accumulations will occur on grassy surfaces. So once again lets look at the plume diagrams to see how much snow 27 different model runs produce over Spokane, Coeur d'Alene and Pullman.

Spokane plume diagram shows snow totals ranging from 0.0 - 2.5" with an average around 0.3" 


Coeur d'Alene plume diagram shows snow totals ranging from 0.0 - 5.3" with an average around 0.8" 

Pullman plume diagram shows snow totals ranging from 0.0 - 3.5" with an average around 0.5" 

Generally speaking, these values are on par with what the models were showing last night, however with the band moving further to the north, the snow totals in Pullman are trending lower. Motorists are still urged to check the latest forecast before venturing out in the morning and be prepared for a potentially snowy commute. Here is our latest snow forecast.

Snow forecast for Tuesday (issued 9 pm Monday )


1145pm Monday Update....the band of precipitation was beginning to take form. Our confidence is growing the moderate to locally heavy precipitation band will develop. Still not sure if heavy snow will accumulate.

1147pm radar imagery. Note heavier precipitation developing between  Davenport and Ritzville. 


Is a significant snow event possible for Spokane,Coeur d'Alene or the Palouse Tuesday morning?


Although the weather of late has been quite wet, the overwhelming majority of the precipitation has fallen as rain (or melting snow) in the valleys of eastern Washington and north Idaho including the Spokane/Coeur d'Alene area and the Palouse. That might change however as an unusual weather pattern materialises on Tuesday morning resulting in the possibility of significant snow. So what is the weather pattern which might lead to this unusual snow? To get significant snow in the valleys this time of year you need several things. First, you want to have a fairly strong upper-level trigger. In this case, we will be dealing with a slow moving upper-level disturbance or vorticity maximum.

500 mb pattern 2 am-2 pm Tuesday

The emphasis is on slow. The loop above shows the disturbance quite nicely between 2am-2pm Tuesday. The green area represents where the forecast model is placing the best moisture. Notice the feature also looks like a semi-circle indicating a tight circulation in the upper atmosphere which should lead to increased upward motion.

Another ingredient we like to see to enhance this upward motion is deep instability. This helps enhance the upward vertical motion between the ground and the upper atmosphere. So will the atmosphere be unstable? You bet. The orange and red shading indicates where we expect to see the most instability (however it's unstable everywhere across the region.
Lapse Rates through the mid-atmosphere 2am Tue
So couple the presence of the instability and the upper-level disturbance and here is where one model solution suggests we will see the greatest lift. Areas in purple and light purple are where the models expect to see the greatest ascent and thus the best potential for precipitation.
Upward motion through the mid-atmosphere 2am Tuesday

Finally, you need an atmosphere which is cold enough to support snow. This is the least confident part of the forecast. Model solutions are suggesting that the temperatures before the precipitation arrives early Tuesday will be above freezing, but then they slowly fall as the precipitation intensifies during the morning at least over a very small area (denoted in light or dark blue).

8am Tuesday Temperatures

So we have the ingredients in place for a heavy precipitation event (albeit fairly localized). Now the question is where will this band of precipitation set up and will it become heavy enough that it can produce accumulating snows in the valleys. That is a tough question to answer since there has been considerable model variability. What we can gather is more often than not the model solutions have depicted a northwest-southeast or west-east oriented band of precipitation similar to the two panes in top portion of the image below. Some of these amounts are quite impressive. The areas in purple show precipitation amounts above 0.75 inches and the red areas are showing more than an inch. So is it possible that most of not all this will fall as snow? It is certainly a possibility. 

12hr precipitation amounts forecast between 2am-2pm Tuesday
So just how much snow are we talking about?  Well here is a plume diagram showing 27 different model possibilities or solutions for the Pullman/Moscow area. While some of the models are hinting at a little more than a trace of snow, the most impressive solution is showing nearly 8 inches! The average snow amount from all the variations is just over 1" of snow.  For the Spokane area, the forecast is nowhere close to as snowy as for Pullman. The maximum snow forecast is around 2.25" but the average is around a quarter inch. That's a lot of variation, to say the least. 

Plume Diagram for snow for Pullman (Click image for larger view)


Plume diagram for snow for Spokane (Click image for larger view)

So what do we expect to happen? We are fairly confident we will see a band of moderate to locally heavy precipitation develop on Tuesday morning. Again the question is where will this occur and will the atmosphere be cold enough to support heavy snow? The other variable is will the ground be cold enough allow accumulations to occur on the roads? If the snow gets heavy enough (quite possible) we suspect the answer will be yes. Motorists are urged to prepare for the possibility of winter driving conditions for the Tuesday morning commute. Chances are the afternoon commute will be much easier as any threat of accumulating snow diminishes. Hopefully, as the event nears our confidence will grow as to where we expect to see the greatest risk of significant snows. 


Friday, April 3, 2015

Will the Inland Northwest see snow on Sunday night and Monday?

The Spring thus far has been fairly mild, and as a result we haven't had to worry about the threat of snow. The temperatures for March were some of the warmest if not the warmest on record for many locations.

March temperatures
But all weather patterns come to an end at some point and this will be no exception. So here is what the upper-level weather pattern for most of the month of March looked like. It showed a rather persistent ridge focused over the West Coast with the storm track nudged well north of our area
Mean 500 mb pattern for March 1-March 29th
However since the end of the March and continuing into April, the upper-level ridge has shifted to our east, allowing the upper-level trough to nudge into the eastern Pacific and the storm track to push through the Pacific Northwest.
Mean 500 mb pattern March 30th-April 1st
This has resulted in more typical springtime weather for the region including significantly cooler temperatures, and numerous afternoon/evening showers and thunderstorms accompanied by an Inland Northwest springtime staple: graupel. But despite the cooler weather, most of the valley locations, have yet to deal with snow. That might change though with the arrival of the next significant weather system. The model solutions are rather convincing that this system will arrive sometime between late Sunday night and Monday as the deep offshore trough heads inland.

500 mb pattern for Monday morning
Referring to  the map above, it suggests most of the upper-level energy will remain poised off the southern Oregon/Northern California coast, however look closely over extreme northeast Washington/north Idaho and notice the small yellow circles. These indicate the larger trough will also contain several small shortwave troughs.  If these troughs are accompanied by enough moisture and instability they can trigger small bands of moderate to intense precipitation, or what we
meteorologists term meso-banded precipitation or mesobands. Even more intriguing is these mesobands can often allow snow to fall (and possibly accumulate) at much lower snow levels than expected.

The odds are quite good that the region will see mesobands of precipitation form, the big question is where and what will the impacts be?

To answer the first question of where will these bands form, we first need to look at the positioning and track of any surface low tracks. Here is a look at four weather models we typically utilize and where they place the low (and resultant precipitation) as of 5am Monday morning.

4 model solutions with surface low position and 6-hour precipitation valid 5am Monday
As you can see above, all four models have a surface low located over the eastern third of Washington or north Idaho, however, the exact positioning and strength of the low is quite variable. The solution in the upper left corner is by far the most impressive solution. It has the strongest surface low (1000 mbs) and the heaviest amount of precipitation. The purple colors in this image represent precipitation amounts between 0.50-0.75" in a six-hour period. The other model solutions show a weaker low (1005-1006 mbs) and much lighter precipitation amounts.

When there are wide disparities between our core models we like to defer to ensemble modeling. This is where we take an initial model run and add small perturbations to the mix. The perturbations begin small but with time tend to grow. When the models cluster the positioning of a low, this boosts our confidence in the forecast, whereas if lows are strewn haphazardly across the region, our confidence is quite low. So here's a look at the SREF positioning of the surface lows for Monday morning.

SREF Surface low positions for 5am Monday


Although there are plentiful lows (L's) found across the Inland Northwest there is a wide scattering of their positions. The fact that there are plentiful lows is good from a standpoint of there is fair confidence of an event occurring. However, the wide scattering of the L's lowers our locational confidence significantly.  We can also look at the mean of all the low positions and the mean of all the precipitation data to come up with a preliminary snow forecast. In this case, the SREF is showing this as the mean snowfall for the 12hrs ending at 11 am Monday.

Mean 12hr snowfall ending 11am Monday
While these values themselves are not impressive (1-2" for the areas shaded in green) the fact that this model is showing such widespread snow is noteworthy. Another interesting thing we can look at from the SREF model is a plume diagram which shows all the suite of model solutions on one chart. So given the map above, it would seem locations north and east of Spokane as well as near the Cascade Crest would see the best chances of snow. So to hone our forecast a little more we will look at some plume diagrams to determine potential snow amounts. The first we will refer to is for Sandpoint.

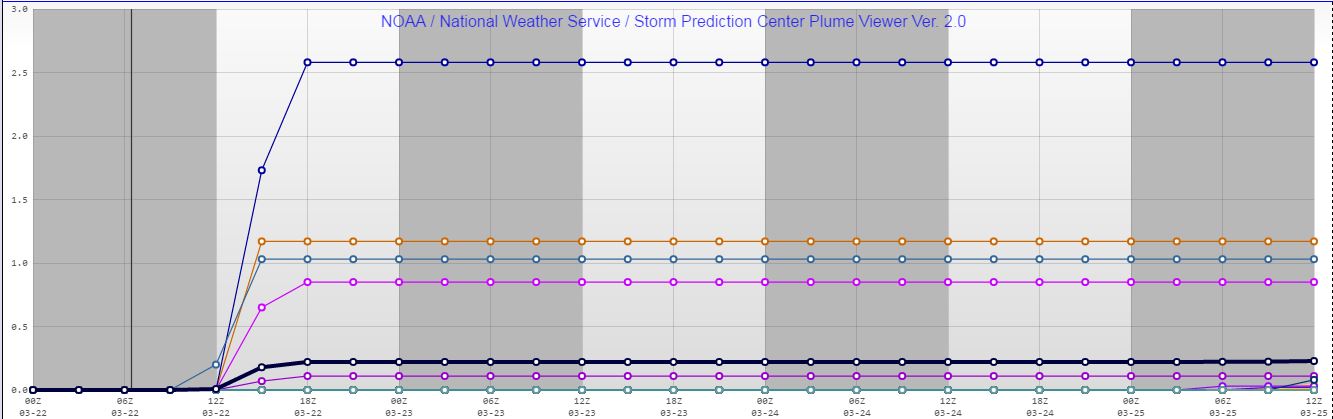
Sandpoint snow plume diagram
Each line on this plot refers to one particular member of the SREF ensemble. In this case, most of the solutions are showing some snow on the right side of the diagram. The mean of the runs is denoted by the black line which is indicating a mean snowfall of 2". More impressive (but not probable) is the pink line which shows snowfall totals exceeding 8".  How about the plume diagram for Spokane?

Spokane snow plume  diagram
Even the Spokane plume diagram is showing some snow. Nothing compared to Sandpoint, but some snow nonetheless. The mean snowfall is right around an inch, however, there is one run which shows  totals nearing 5"!

Now despite these snow forecasts, the other factor to consider is how easily will this snow accumulate on the ground? The temperature forecast for late Sunday night and early Monday morning is for readings in the lower to middle 30s. Certainly cold enough for snow, but perhaps not enough for significant accumulations, especially in the Spokane area. After sunrise, temperatures will slowly climb into the upper 30s to middle 40s which suggest snow accumulations are even less plausible except perhaps on grassy surfaces. 

So in summary we are fairly confident a deep but compact surface and upper-level low-pressure system will track through the Inland Northwest producing locally moderate to heavy precipitation some of which will fall as snow. Where it will go and what time of day it hits will be critical for determining what it's impacts will be. Winter driving conditions are certainly possible for the Monday morning commute, especially north and east of Spokane. In the meantime, stay tuned to our latest National Weather Service Forecasts and don't put away your winter clothes quite yet. 

Tuesday, January 20, 2015

This winter compared to last...and will we see a normal recovery?

A couple weeks ago we posted a story on our Facebook page that said, climatologically speaking the harshest part of winter is now in our rear view mirror. Here's was the post.


We stated that since the days are getting longer, sunnier (very slowly) and temperatures are on the rise that in fact, climatologically speaking the worst is over with. However, we did put a caveat in the story which said we can still get some very good winter storms during the remainder of January into February. One astute reader mentioned that we stated something similar last year in a blog entry. Last winter we had a very dry and relatively snowless beginning to the winter and wondered what the chances were of it continuing. Needless to say we recovered quite nicely in the second half of winter. This winter, things might be just a bit tougher. Just for comparison sake, here was the mountain snowpack last year on this date.


And here's how it looked this year


Not a lot of differences. All locations were seeing below normal snow water equivalent values for both years. The Okanogan Highlands and the northern Cascades are doing a little better this year, and things are a little worse elsewhere.  Also, notice how poor the snow water numbers are for the southern Washington Cascades and the Oregon Cascades.  However, these maps aren't really telling the entire story. Why is that? If we choose to just look at the amount of precipitation which has fallen since October 1st (beginning of the water year) rather than the amount of water in the snowpack the winters are completely different. Here was 2014 through January 19th. Just like the drier than normal snowpack, the precipitation was similarly dry.
Oct 1 2013-Jan 13 2014 percent of normal precipitation
Now look at the data for this water year. What a difference a year makes! All basins are seeing normal to slightly wetter than normal conditions.


So what gives, why the big difference? In one-word temperatures. Temperatures this winter and late fall have been significantly warmer temperatures than what we saw last year. Much of what's been falling has been dropping as rain as opposed to snow. Take a look at the temperature departures from normal below. They exhibit a huge difference. In the first half of winter 2013-14 temperatures were well below normal.
Oct 1-December 2013 temperature departures. Note widespread below normal temperatures
 While this year...they have been generally well above normal. The swing from last winter to this winter is around 3-6°F warmer. That may not seem like a lot, but in terms of snow it makes a big difference.

Oct 1-Jan 18 temperature departures. Note widespread warmer than normal temperatures. 

Anyway we digress. We simply wanted to demonstrate that although we have seen similar snow totals to last winter in the mountains, how we got to those totals is completely different. Last year was an ENSO neutral year which often does not foretell what sort of winter to expect. This year is an El Nino winter (albeit a weak one). Typical El Nino winters deliver warmer than normal conditions (sure enough it has been warmer), and a variable precipitation signature. So let's examine some snowfall numbers across a few valley locations including Spokane, Wenatchee and the always snowy Holden Village (on Lake Chelan). Just like the mountains, most valley locations are seeing sharp snow deficits. In fact, most locations are seeing a top-10 least snow winter since 1949. We are utilizing 1949 since that year is when the NWS began keeping track of  El Nino/La Nina data.

Least 10 snowy Spokane winters through 1/19 since 1949

Least 10 snowy Wenatchee winters through 1/19 since 1949

Least 10 snowy Holden Village winters through 1/19 since 1949
So of those three sites, this year ranks as either the 5th or 6th least snowy winter through 1/19. But more importantly how did the rest of the winter fare and could the snowfall deficit be made up. The answer is an overwhelming no. In Spokane, none of the 10 least snowy years through 1/19 was able to recover to normal. The winter of 1989-90 was close. Last year was also somewhat close as much of the region saw a record or near record snows in February. However, those were not El Nino years. Of the El Nino years, three of them, the remainder of the winter failed to deliver more than 6 inches of snow.

For Wenatchee, two of the winters were able to recover to above normal levels after such a slow start to the snow season.  Both of those years were ENSO neutral years. During the El Nino years, the numbers were quite meager. The two El Nino winters on the list experienced snowfall of less than an inch through the remainder of the season. On average, less than 5" of snow typically falls during the remainder of the season. 

Now onto the ever snowy Holden Village area. The numbers for here spell bad news for heavy snow lovers. Of the 10 least snowy winters through 1/19, none were able to get back to normal. Last year was close (after an astounding and record breaking 142" of snow in February) as was 1989-90. Both of those years were ENSO neutral ones. The trends during an El Nino year are much less promising. Of the 4 El Nino years on the list, none were able to recover to normal levels. Additionally, 3 of the 4 El Nino years saw significantly less snow than normal through the remainder of the winter.

So climotology tells us the odds of recovering from such a slow start to the winter are slim and given our weak El Nino conditions the chances are even slimmer. However, keep in mind that long-term weather forecasting can prove a futile endeavor and ultimately anything can happen. 

Through the remainder of the month the weather pattern will not be conducive to adding significant amounts to our  snow totals. Although wet weather will likely return by the end of the week, this moisture will be accompanied by unusually warm temperatures at least over the mountains. The 6-10 and 8-14 day outlooks are calling for a good chance of warmer than normal temperatures and average or slightly wetter than normal conditions. 

8-14 day precipitation outlook

8-14 day temperature outlook

Monday, December 22, 2014

Odds for a White Christmas: Update

OK, we're only 3 days away from the Big Day, and snow is still hard to come by in my Inland Northwest locations.  Is there any hope for a White Christmas?  Here's the current snow depth analysis:


Pretty pathetic.  Folks in the Cascades are doing well, as are those in some of the northern valleys (e.g. Omak, Republic, etc).  Otherwise, lots of bare ground.  

Just to refresh your memory, here was last year's snow cover at this same time. Not stellar, but better than this year.


But there's still time to change this, right?  Actually, the answer is "yes", for some locations anyway.  As we've been discussing in earlier blogs, the computer models have been suggesting a Christmas Eve storm for over a week now, but they've been waffling on the exact timing, track, etc.  And these small differences play a HUGE role in who will get precipitation, and in what form will it fall.  But now, the models are in fairly close agreement. So let's take a look at what they're saying.

Below is the GFS forecast precipitation for the 12 hours ending 4pm Wednesday.


While this looks encouraging, unfortunately almost all of this will fall in the form of rain.  Snow levels during the morning hours will be around 6000' but will rapidly fall through the day as cold air moves in from the north.  Can the snow levels drop all the way to the valleys before the precipitation ends?  Maybe, but this is typically a poor pattern for valley snow.  And even if it does snow in the valleys, it will have a hard time accumulating on the ground during the afternoon/evening hours.

Here's the probability of 1" or more snowfall on Christmas Eve. 


Things are looking up for folks in the Idaho Panhandle.  Meanwhile things look bleak for locations in central/eastern Washington, with locations west and south of Spokane having next to no chance for snow.

So, looks like a brown Christmas for many folks.  The interesting climate tidbit in all this is that we could set an obscure record at Spokane.  The latest that it's ever taken for the Spokane Airport to have it's first 1" or greater snowfall from one storm is Dec 24th 1976.  Unless the forecast changes in a hurry, we'll break that record.  But not by much.  Why you ask?  Because it's is now looking very good for a decent snow event after Christmas.

Here's the 24-hour precipitation forecast from the GFS ending Saturday evening:


Looks similar to the Christmas Eve storm, right?.  The difference is that just about all of this will fall in the form of snow instead of rain.  The reason is that while the Christmas Eve storm might not bring much snow, it will bring colder air.  So by the time this second storm arrives, we'll be much colder.  Different models have different amounts of snow, but in general they all have a solid 2-4" for most locations with the potential for higher amounts.

Here's the snowfall forecast from the NAM (red) and GFS (blue/purple) for Spokane. 


There are different forecasts here using different techniques.  But in general they give a similar message.  Snow will start Friday evening and continue into Saturday evening.  The ECMWF (not shown) has a similar story, but doesn't start the snow until Saturday morning and continues it into Sunday.  Either way, there is the potential for several inches of snow.

It's too early to hang-your-hat on this forecast.  But one of the things we like to see is that each model forecast is similar to the previous one (GFS runs every 6 hours, ECMWF every 12).  And they've been saying a similar message for about the last 24 hours.  So that's a good sign and gives us confidence that this forecast could indeed pan out.  But the overall pattern for this storm isn't necessarily a favorable one for heavy snow in the Inland Northwest.  The mountains will almost assuredly pick up some snow from this, but the lower elevations might not see much. Stay tuned to the forecast, especially if you plan to travel this weekend.