Thursday, September 7, 2017

Is the Smoke of 2017 worse than 2015 or 2012?

It is 10 PM on Thursday, September 7th. The city of Spokane and the rest of the Inland Northwest remain cloaked in thick wildfire smoke. As we discussed in the blog yesterday, this is not the first time this summer that smoke has blocked our views of nearby mountains or caused residents to close their windows to prevent the smell of smoke from entering their homes. Many long-time residents of our region are asking, "Has the smoke ever been this bad?".  Within the last couple of days, several local television stations and newspapers have discussed this topic. Their stories have referenced measurements from air quality sensors with comparisons to wildfire events in 2012 and 2015.

Let's take a closer look at how our current situation compares to 2012 and 2015.  We will examine visibility as a correlation to smoke "thickness" and look at visible satellite images to determine the extent or volume of smoke.

Visibility: For the thickness of the smoke, let's look at visibility sensors at a few airports in central and eastern Washington. Airports measure visibility because horizontal visibility is extremely important for pilots and air traffic controllers. These sensors measure the horizontal visibility in miles. On most summer days, the horizontal visibility in the Inland Northwest is well over 10 miles. On clear days, mountain ranges 30 to 50 miles away are very easy to see. Visibility reductions to 6 miles are somewhat rare during the summer months and are usually caused by smoke or wind-blown dust. In the summer, visibility reductions to 2 miles or less (without precipitation present) are very rare, and are usually limited to locations in the immediate vicinity of a wildfire.

For this blog, we are going to use visibility restrictions to 2 miles as a benchmark for being a "Bad Smoke Day". The picture below is an example of of 2 miles visibility.

Wenatchee Airport Visibility:  This picture is from a web camera at the Wenatchee Pangborn Airport early in the afternoon on September 7, 2017 (Today). The visibility sensor at the airport was reporting a horizontal visibility of 2 miles at this time. On a clear day, the Cascade Mountains would be easy to see behind the airplane and airport buildings. Looking at Google Earth, the foothills of the Cascades are about 4 to 7 miles west of the runway.

2012 Versus 2017: Wenatchee


The summer of 2012 featured the "September of Smoke" in Wenatchee, WA.  An extended period of dry weather with light winds allowed smoke to flood the Wenatchee and Columbia River Valleys during most of September and parts of October. The smoke largely came from several fires that comprised the Wenatchee Complex south and west of Wenatchee. The worst stretch of smoke occurred from the evening of September 12th through September 23rd. For 12 consecutive days, the visibility at the Wenatchee Airport was 2 miles or less for many hours each day. There were some short windows of improved visibility during those 12 days, but there were very few observations during this stretch when the visibility improved to 5 miles.

How does the summer of 2012 in Wenatchee compare to this summer so far? Check out this graph. Keep in mind that the worst smoke in 2012 occurred from mid to late September, and we are only one week into September 2017. Smoke or haze was occasionally reported at the Wenatchee Airport into late October.


For Wenatchee, the summer of 2012 was horribly smoky. The fires of 2012 were much closer to the city than the fires of 2017...at least for now. Check out a couple satellite images from September 2012.

September 13, 2012: The visibility in Wenatchee was at or below 2 miles for much of the day on September 13th as smoke from the Wenatchee Complex south and west of town filled the Wenatchee and Columbia River Valleys.

September 19, 2012:  A plume of wildfire smoke can be seen streaking across central Washington from the Wenatchee Complex.
Now, compare the 2012 images (above) to the visible satellite image from yesterday -- September 6, 2017 -- below. There is no comparison in the volume of smoke!!!  In 2012, the wildfire smoke that impacted Wenatchee was more localized. Yesterday's satellite image shows thick smoke over all of Washington, Oregon, Idaho, and most of western Montana. This year there are many more large fires contributing to a much larger area of thick, thick smoke.

September 6, 2017: This visible satellite images shows thick smoke over the entire Pacific Northwest.
2012 vs 2017 Conclusion (so far): At least for Wenatchee, the summer of 2012 was worse than 2017 has been in terms of smoke duration. However, there have been at least two or three smoke episodes in 2017 that have covered much larger portions of Washington than in 2012.

2015 Versus 2017:  Spokane

The August 21st "Smoke Storm" in 2015 produced a wall of thick smoke that invaded the Spokane Metro area. The visibility in the city rapidly decreased from over 10 miles in morning to less than 2 miles in the mid afternoon into the evening hours. The smoke originated from several fires in central and northeast Washington including the Wolverine Fire (Lake Chelan), the Okanogan Complex (near Omak), and the Carpenter Rd Fire (Hunters WA). Northwest winds of 15 to 20 mph behind a cold front were responsible for directing the wall of smoke into Spokane. Check out the visible satellite image below. Look how the northwest winds funneled smoke from 3 large fires into the metro.

August 21, 2015:  The Wolverine Fire near Lake Chelan, the Okanogan Complex near Omak, and the Carpenter Rd Fire near Hunters WA produced a concentrated smoke plume that decreased the visibility in Spokane to 1.25 miles.
Our current smoke episode (Sep 4 - 7) has produced a much longer period of visibility less than 2 miles. At 9 PM Sep 7th, the Spokane Airport had experienced 79 consecutive hours of 2 miles.  The 2015 "Smoke Storm" only produced 6 total hours of visibility less than 2 miles. Our current episode has also produced visibility reductions as low as 1 mile at the International Airport compared to 1.25 miles in 2015.


Was the 2015 "Smoke Storm" an isolated occurrence of smoke that summer? It was not. The summer of 2015 had 31 days with visibility reductions of 6 miles or less due to smoke or haze. The summer of 2015 set records for the number of acres burned in the state of Washington with large fires in Chelan, Okanogan, Ferry, and Stevens Counties. With all of the fires, smoke and haze was common in Spokane as early as June in 2015.

2015 vs 2017 Conclusion: In comparing the 2015 "Smoke Storm" to our "Labor Day 2017" smoke event, 2017 has easily had the bigger impact. Not only have we experienced a lower visibility with our influx of smoke in 2017 (1 mile visibility versus 1.25 miles), but the duration of smoke has been much greater. Spokane has been going on 4 days of visibility at or below 2 miles in this ongoing smoke event. The 2015 "Smoke Storm" only produced 6 hours. Will the 2017 season equal the number of smoke days (6 miles or less) in 2015? Let's hope not.

Outlook:  Increasing west winds on Saturday (Sep 9) should help clear some of our smoke from the Inland Northwest. However, widespread rains are not expected anytime soon. Without decent rains, smoke will likely return. The wildfires of 2017 have certainly surpassed 2012 and 2015 for flooding the Pacific Northwest with a volume of thick (less than 2 mile visibility) smoke. We will see if the smoke will linger well into September or October to rival the summers of 2012 or 2015 for total number of smoke days.

Wednesday, September 6, 2017

The Smoky Summer of 2017


The summer of 2017 will be remembered as one of the smokiest in memory for many residents of the Inland Northwest. So far this summer, our region has had three main smoke events.

Event 1:  August 1st-13th -- Smoke from British Columbia.

In early August, large wildfire complexes in British Columbia were the primary source of smoke for Washington and north Idaho. Several days of north winds pushed wildfire smoke from Canada into the Inland Northwest. By Aug 3-4, much of the Inland Northwest was shrouded in wildfire smoke. This smoke would linger through the weekend of Aug 12-13 when a cold front finally pushed the smoke out of our region.


August 1st:  This "True Color" visible satellite image is from the morning of August 1st. Look at thick smoke in southern B.C. pour into north central Washington through the Okanogan Valley.

August 4th:  By the 4th, smoke covered most of the state of Washington as well as large portions of Idaho, Oregon, and Montana.
Event 2:  August 22nd - 30th -- Smoke from Oregon.

In late August, the Inland Northwest received smoke from a different source region. This time large fires in southwest and west central Oregon produced a thick layer of mid and high level smoke that periodically moved across Washington and north Idaho. During this nine-day event, smoke largely remained aloft, but there were periods when places like Lewiston, Pullman, and Spokane experienced visibility reductions to 5 miles or less.

Aug 22nd: This late afternoon visible satellite image shows thick smoke over southwest and west central portions of Oregon. Between August 23rd and 30th, mid and high level smoke from Oregon would produce periods of hazy and smoky conditions over much of the Inland Northwest.

Aug 30th: For most of eastern Washington, North Idaho, and central Oregon, the worst day of smoke in late August occurred on the 30th prior to the arrival of a cold front. In Spokane, the visibility dropped to 5 miles shortly after sunrise on the 30th.

Event 3: Sep 4th - 8th  -  Smoke from Montana + Washington Cascades + Oregon

Our ongoing smoke event has been the worst so far this summer. The arrival of a cold front on Labor Day (Sep 4th) imported thick ground level smoke from Montana into our region. In addition to the thick low level Montana smoke, fires in the Washington Cascades and Oregon added a good deal of mid and high level smoke over the Pacific northwest.

With widespread visibility of 2 miles or less in Washington, Oregon, and Idaho...our ongoing smoke event is the worst so far. It will likely be late Thursday or Friday before "cleaner" west winds push smoke out of the Pacific Northwest.

Sep 6: Milky white smoke covers all of Washington, Oregon, Idaho, and much of western Montana in this "True Color" visible satellite image from the afternoon of September 6th.

Tomorrow evening, we will compare our ongoing smoke event (Sep 4th - 8th) to the Spokane "Smoke Storm of August 2015" and Wenatchee's "September of Smoke in 2012".


Saturday, July 1, 2017

Hot weather ahead

It has been awhile since we last updated our blog, its been a busy spring season with quite a bit of flooding across the Inland NW.  After a record wet October through April for many, the weather has made a big turn towards a warmer and drier note.  And the weather ahead looks hot!

Brief June recap
June brought slightly warmer than normal temperatures for most.  The more noteworthy item was how dry it was especially along the East Slopes of the Cascades and up near the Canadian border where many places only received 25-50% of normal precipitation as image below shows.


A few places lucked out with more beneficial heavy rain from thunderstorms, but for most of Central and Eastern Washington and north Idaho June finished drier than normal.  This has helped dry out the grass with several reported grass and brush fires over the past week, some of which were sparked by lightning.  Here is what the Sutherland Canyon Fire east of Wenatchee looked like on June 28th:

Credit: BLM/ Richard Parrish

Looking ahead
So what does the future look like?  Models for the past couple days have been showing a hot weather pattern setting up after the 4th of July.  Let's dig further into this and see just how hot it may get.

Starting with Monday, nothing too noteworthy, a low pressure system tracks north of us giving a westerly flow to the area suppressing the hot weather well to our south (white colors on map).  This system will increase the winds a bit with elevated fire weather concerns over the Columbia Basin and Wenatchee area.


18z/July 1st GFS Forecast valid 00z Tuesday (5 PM PDT Monday) of 500mb heights and 850mb temp (image)

How about the 4th of July?  It looks warm and dry.  Here is our forecast of max temperature and minimum relative humidity as of July 1st.

NWS Forecast of Max Temperature issued 2 PM July 1st for the 4th of July

NWS Forecast of Min Relative Humidity issued 2 PM July 1st for the 4th of July

As you can see, it will be warm with highs in the upper 80s to mid 90s, and very dry with relative humidity between 12-20% for most towns, so be careful with fireworks!

Then the real heat begins.  The Four Corners High over the desert southwest amplifies north and west bringing increasing heat.  Here is Wednesday's pattern...
18z/July 1st GFS Forecast valid 00z Thursday (5 PM PDT Wednesday) of 500mb heights and 850mb temp (image)

The red colors represent very warm temperatures and white downright hot!  And then there's Friday...

18z/July 1st GFS Forecast valid 00z Saturday (5 PM PDT Friday) of 500mb heights and 850mb temp (image)

As you can see, the hot weather makes an aggressive move north all the way into western Canada giving us some toasty temperatures.  How hot?  It's a little too early to pin this down but here is what some model data is suggesting.

Model forecasts initialized July 1st of temperatures through July 8th
The GFS model suggests Spokane may get close to 100 and Moses Lake even hotter...nearing 105. Some other model solutions have been slightly cooler then this, but still well into the 90s.  Get ready for hot weather!  The prolonged period of hot and dry weather will likely be leading to an increase in  fire danger across the region over the next week, and possibly beyond.  Here is the 8-14 day outlooks from the Climate Prediction Center issued July 1st valid from the 9th through the 15th.


These outlooks favor elevated odds for warmer and drier than normal conditions.

Don't forget the sunscreen and drink lots of water!

Wednesday, March 8, 2017

Wet recap plus warmer and windy weather ahead!

This fall and winter has sure been wet across the Inland NW!  This winter has also been on the cold side giving many areas above normal snowfall.  While it has been cold and snowy for quite some time, the pattern is about to change.  Let's look back first at some interesting findings from the fall and winter.

FALL/WINTER RECAP
So far this water year (Precipitation totals beginning October 1st) has been off to a very wet start.  Here is a map for the entire west showing how wet it has been.


As you can see, for many places across eastern Washington and north Idaho precipitation since Oct 1st ranked in the top 10%.  For much of northern California into western Wyoming the October-February period ranked the wettest on record.

Wettest Period on Record for Spokane
If you look closely at the map above, you can see a small area of dark green (record wet) over Spokane.  Sure enough, the October-February period was the wettest on record for Spokane.  The month of October contributed an all-time monthly precipitation record 6.23 inches to the 16.28 inch total.  Here is a graphic (October 1st through March 7th) of how Spokane ranked.


Not only has it been wet, it's been a rather cold winter as the map below shows.

No records for cold temperatures, but certainly below normal especially in the Columbia Basin.


A LOOK AHEAD
The weather pattern is about to change.  The Inland NW is heading into a milder pattern through next week and there is a lot to talk about.  Let's begin with tomorrow (Thursday).

12z/8th GFS forecast of 500mb heights and 700-500mb Relative Humidity for 4 PM PST Thursday (00z Friday)

A milder southwest flow pattern develops with increased moisture (green shade) entering the region.  This will bring a shot of rain except snow for the Cascades, northern Washington and Idaho mountains, and some northern valley areas.  Most of this will fall in the afternoon and evening.  After this, a low pressure system tracks along the Canadian border on Friday producing windy conditions for much of the area.

NWS Forecast of wind gust issued Wednesday afternoon for Friday afternoon (10 AM-4 PM PST)


After that, the milder pattern continues...here is Saturday

12z/8th GFS forecast of 500mb heights and wind 10 AM PST Saturday, March 11th (18z Saturday)
The model shows a large upper level trough in the eastern Pacific giving Washington and north Idaho mild southwesterly flow.  Another wave comes across for another round of precipitation.  Additional waves (not shown) may bring more opportunities for rain early next week.

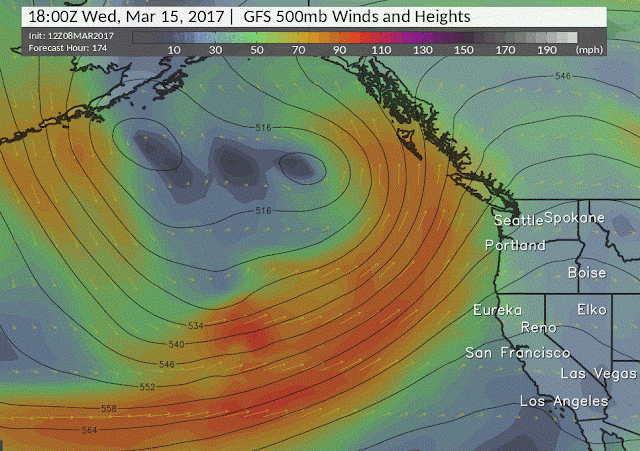
And how about next Wednesday (March 15th)


The mild weather pattern continues as southwest flow continues.  Overall all of the computer models are in good agreement of this mild pattern continuing through at least the middle of next week.

Here are what some of the computer models are suggesting for Spokane for temperatures:

Meteogram for Spokane Airport showing model forecast of temperatures beginning today (Wed) going out through next Wednesday from left to right


High temperatures warming into the lower to mid 50s are a good bet early next week.

The mild weather and occasional rain may cause some minor flooding concerns.  The good news is that we don't see any prolonged periods of heavy rain.  However the combination of rain and snow melt will lead to rises on area rivers and streams.  So where is the snow now?  Here is map showing how much water is in the snowpack.

Modeled SWE (Snow Water Equivalent) for 1 PM PST today (Wednesday, March 8th)

Overall there is plenty of snowpack in the mountains...as well as quite a bit in the mountain valleys north and east of the Columbia Basin.   Here's a map highlighting our current areas of concern for possible flooding for Thursday night and Friday.


For the latest river forecasts, please go to the following link

To summarize, after a cold and wet winter milder temperatures and occasional rain may lead to minor flooding.  In addition windy conditions are expected for much of the area on Friday.